

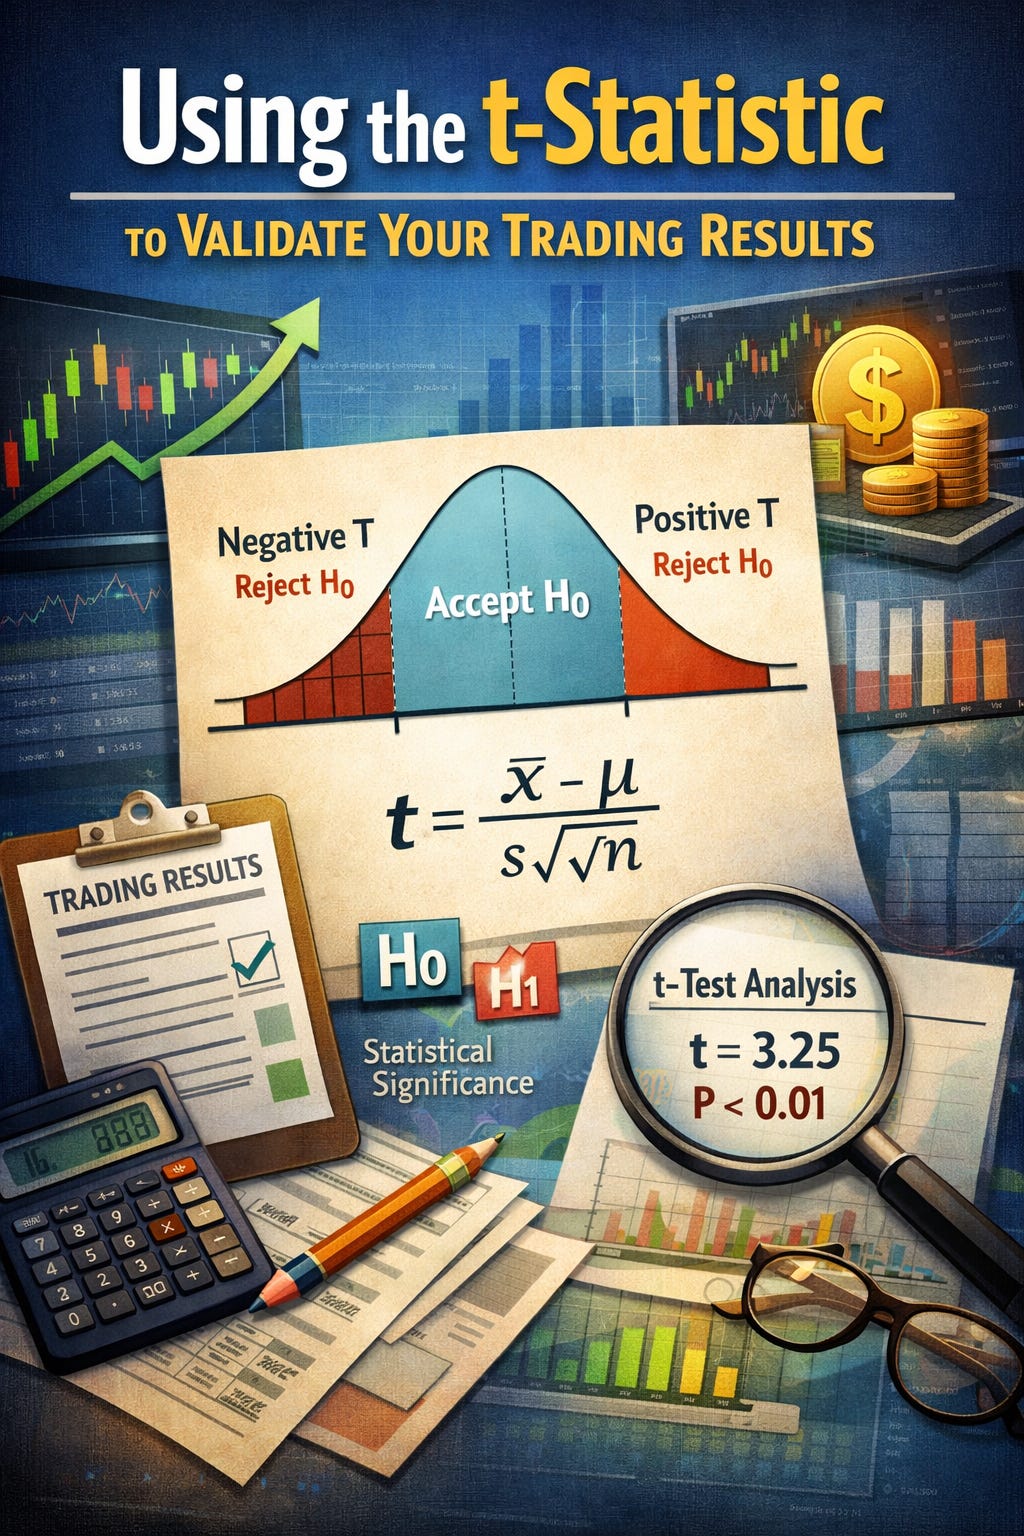
If you’ve been trading for a while, you’ve probably had this thought:
“These returns look good. But are they real?”
Not real as in “did the broker miscalculate,” but real as in statistically meaningful. Real as in unlikely to be luck. Real as in something you could expect to persist, at least a little, going forward.
That question is harder than it sounds. Markets are noisy. Strategies can look amazing for long stretches purely by chance. And the more you test, tweak, and optimize, the easier it is to fool yourself.
This is where the t-stat comes in. The t-statistic is not flashy. It doesn’t promise alpha. It won’t tell you why a strategy works. But it does something incredibly valuable:
It asks, in a disciplined way, whether your average return is distinguishable from zero.
In other words: Is this edge likely real, or could it just be noise?
What the t-Stat Actually Measures
At its core, the t-stat is very simple. It’s the average return of your strategy divided by the uncertainty around that average. Written plainly:
t-stat = (average return) / (standard error of returns)That’s it. But each part matters.
Average return: How much you make per period.
Standard error: How noisy those returns are and how many observations you have.
This means the t-stat naturally balances three things:
How big your edge is
How volatile your returns are
How much data you have
A strategy with small but consistent returns can have a higher t-stat than one with large but erratic gains. That’s already a useful insight.
Why Traders Should Care About the t-Stat
Most traders fixate on metrics like CAGR, Sharpe ratio, or max drawdown. These are important. But they answer slightly different questions.
The t-stat answers this one:
“If the true expected return were zero, how surprised should I be by what I observed?”
That’s a powerful framing.
If your t-stat is low, your results are not very surprising under a “no edge” world. If your t-stat is high, they are.
This matters because markets are full of strategies that look good by accident.
Random entry systems
Overfit backtests
Strategies tuned to one market regime
Survivorship-biased portfolios
The t-stat gives you a first line of defense against self-deception.
Interpreting the t-Stat (Without a Stats Degree)
Here’s the rough intuition most traders use:
t ≈ 0: No evidence of an edge
t ≈ 1: Weak evidence
t ≈ 2: Moderate evidence
t ≥ 3: Strong evidence
In academic finance, a t-stat of around 2 is often treated as the minimum threshold for “statistical significance.”
In trading, many practitioners demand more.
Why? Because trading data violates assumptions.
Returns are not perfectly independent. They’re not perfectly normally distributed. Regimes change. Slippage exists. Live execution is worse than backtests.
So a t-stat of 2 might be interesting, but a t-stat of 3 or higher is usually where people start to feel comfortable.
A Concrete Example
Suppose you have a daily trading strategy with:
Average daily return: 0.05%
Daily return standard deviation: 1%
Number of trading days: 1,000
First, compute the standard error:
standard error = 1% / sqrt(1000) ≈ 0.0316%Now compute the t-stat:
t = 0.05% / 0.0316% ≈ 1.58That’s not terrible. But it’s not compelling either.
This strategy could easily be noise, especially once you account for transaction costs or regime shifts.
Now imagine the same average return over 4,000 days.
The standard error shrinks, the t-stat rises, and suddenly the edge looks more believable.
This highlights something traders often underestimate: time in the market matters. A lot.
The t-Stat vs the Sharpe Ratio
People often confuse these two, and for good reason. They’re closely related.
In fact, for returns measured at the same frequency:
t-stat ≈ Sharpe ratio × sqrt(number of observations)So what’s the difference?
Sharpe ratio tells you how good the strategy is per unit of risk.
t-stat tells you how confident you should be that the Sharpe is not zero.
A Sharpe of 0.8 over 10 years means more than a Sharpe of 1.2 over six months. The t-stat captures that difference directly.
If you only look at Sharpe, you can be misled by short samples.
Using the t-Stat to Validate Trading Strategies
Here’s a practical workflow.
1. Compute Returns at the Right Level
Decide what one observation is:
Daily PnL
Trade-by-trade returns
Weekly portfolio returns
Be consistent. Don’t mix frequencies.
2. Check the t-Stat on Raw Returns
Before fancy adjustments, ask the simple question:
“Is the mean return statistically different from zero?”
If the answer is no, stop there.
3. Stress It
Now make it uncomfortable.
Remove the best 5% of days
Add realistic transaction costs
Split the sample in half
Test different markets or time periods
Watch what happens to the t-stat. Robust strategies degrade gracefully. Fragile ones collapse.
4. Compare Across Strategies
When choosing between two strategies with similar economics, the higher t-stat often wins. It’s usually the more reliable edge.
The Dark Side: Where the t-Stat Can Mislead You
The t-stat is useful, but it’s not magic. Here are the main traps.
Data Snooping
If you test 1,000 strategies, some will have high t-stats by pure chance. The t-stat assumes you didn’t cherry-pick.
This is why systematic researchers care about out-of-sample tests and multiple-testing corrections.
Autocorrelation
If returns are correlated, the effective sample size is smaller than it looks. Your t-stat is inflated.
This is common in:
Trend-following
Carry strategies
Illiquid assets
You need to adjust for this, or at least be aware of it.
Regime Dependence
A high t-stat in one regime doesn’t guarantee survival in the next. Markets evolve. Edges decay.
The t-stat tells you about the past, not the future.
A Mental Reframe That Helps
Instead of asking:
“Is this strategy good?”
Ask:
“How hard would it be for this result to be random?”
The t-stat is a direct answer to that question.
It won’t save you from bad ideas. But it will stop you from falling in love with fragile ones.
We slashed Quant Atlas prices by 90% and added more markets! If you want chart forecasts every day on 300 markets, start your 10-day Free trial now!