Autocorrelation is the variable’s linear correlation with its own lagged values. Insights may be gotten from autocorrelation that help understand the market’s properties. For example, persistent positive autocorrelation generally happens in trending markets while negative autocorrelation generally happens in ranging markets.
For a detailed and thorough collection of contrarian trading strategies, you can check out my book. The book features a huge number of classic and modern techniques as it dwelves into the realm of technical analysis with different trading strategies. The book comes with its own GitHub.
Contrarian Trading Strategies in Python
Amazon.com: Contrarian Trading Strategies in Python: 9798434008075: Kaabar, Sofien: Booksamzn.to
The Intuition of the Trading Signals
Correlation is the degree of linear association between two variables. It is a number bounded between -1.00 and 1.00 with the following interpretations:
A value of 1.00 represents a perfectly positive correlation which means that the two variables move in the same direction all the time.
A value of 0.70 represents a strong positive correlation which means that the two variables move mostly in the same direction.
A value of 0.00 represents independent variables with no linear association. They have no relationship and does not necessarily move together.
A value of -0.70 represents a strong negative correlation which means that the two variables move mostly in the opposite direction,
A value of -1.00 represents a perfectly negative correlation which means that the two variables move in the opposite direction all the time.
It is worth noting that correlation does not imply causality and therefore we always have to be careful from the results.
Autocorrelation is the correlation of a variable (e.g. price) with its own lagged values from the past. It is generally calculated to understand the market regime. The indicator we are about to create uses autocorrelation and the concept of normality-reversion where high correlations are associated with a return to normality in a cyclical way.
If you plot an autocorrelation chart (of any period), you will notice that it moves from negative to positive territory in a cyclical way which may give some predictive abilities as to when the correlation should reverse.
Coding the AutoCorrelation Indicator in TradingView
The intuition of the indicator is to calculate the autocorrelation of the price using different periods. This gives many indicators that move between -1.00 and 1.00. The indicator’s signal is at 0.75 which have the following meaning:
If all the autocorrelation indicators (a total of 10) are above 0.75 with an RSI below 50, then a bullish reversal may occur.
If all the autocorrelation indicators (a total of 10) are above 0.75 with an RSI above 50, then a bearish reversal may occur
As understood from the trading conditions, the indicator is not a directional one, it only signals reversals. The directional part is given by the RSI.
// This source code is subject to the terms of the Mozilla Public License 2.0 at https://mozilla.org/MPL/2.0/
// © Sofien-Kaabar

//@version=5
indicator("K's Correlation Indicator", overlay = true)
upper_threshold = input(defval = 0.75, title = 'Threshold')

auto_correl_1 = ta.correlation(close, close[1], 2)
auto_correl_2 = ta.correlation(close, close[2], 3)
auto_correl_3 = ta.correlation(close, close[3], 4)
auto_correl_4 = ta.correlation(close, close[4], 5)
auto_correl_5 = ta.correlation(close, close[5], 6)
auto_correl_6 = ta.correlation(close, close[6], 7)
auto_correl_7 = ta.correlation(close, close[7], 8)
auto_correl_8 = ta.correlation(close, close[8], 9)
auto_correl_9 = ta.correlation(close, close[9], 10)
auto_correl_10 = ta.correlation(close, close[10], 11)

//plot(auto_correl_1, color = color.red)
//plot(auto_correl_2, color = color.blue)
//plot(auto_correl_3, color = color.green)
//plot(auto_correl_4, color = color.orange)
//plot(auto_correl_5, color = color.black)
//plot(auto_correl_6, color = color.purple)
//plot(auto_correl_7, color = color.orange)
//plot(auto_correl_8, color = color.rgb(88, 32, 90))
//plot(auto_correl_9, color = color.rgb(100, 48, 48))
//plot(auto_correl_10, color = color.rgb(148, 142, 142))

buy_signal  = ta.rsi(close, 14) <= 50 and auto_correl_1 >=  upper_threshold and auto_correl_2 >=  upper_threshold and auto_correl_3 >=  upper_threshold and auto_correl_4 >=  upper_threshold and auto_correl_5 >= upper_threshold  and auto_correl_6 >=  upper_threshold and auto_correl_7 >= upper_threshold  and auto_correl_8 >= upper_threshold  and auto_correl_9 >=  upper_threshold
sell_signal = ta.rsi(close, 14) >= 50 and auto_correl_1 >=  upper_threshold and auto_correl_2 >=  upper_threshold and auto_correl_3 >=  upper_threshold and auto_correl_4 >=  upper_threshold and auto_correl_5 >= upper_threshold  and auto_correl_6 >=  upper_threshold and auto_correl_7 >= upper_threshold  and auto_correl_8 >= upper_threshold  and auto_correl_9 >=  upper_threshold

//hline(upper_threshold)
//hline(-upper_threshold)

plotshape(buy_signal,  style = shape.triangleup,   color = color.green,  location =  location.belowbar, size = size.small)
plotshape(sell_signal,  style = shape.triangledown, color = color.red,    location =  location.abovebar, size = size.small)
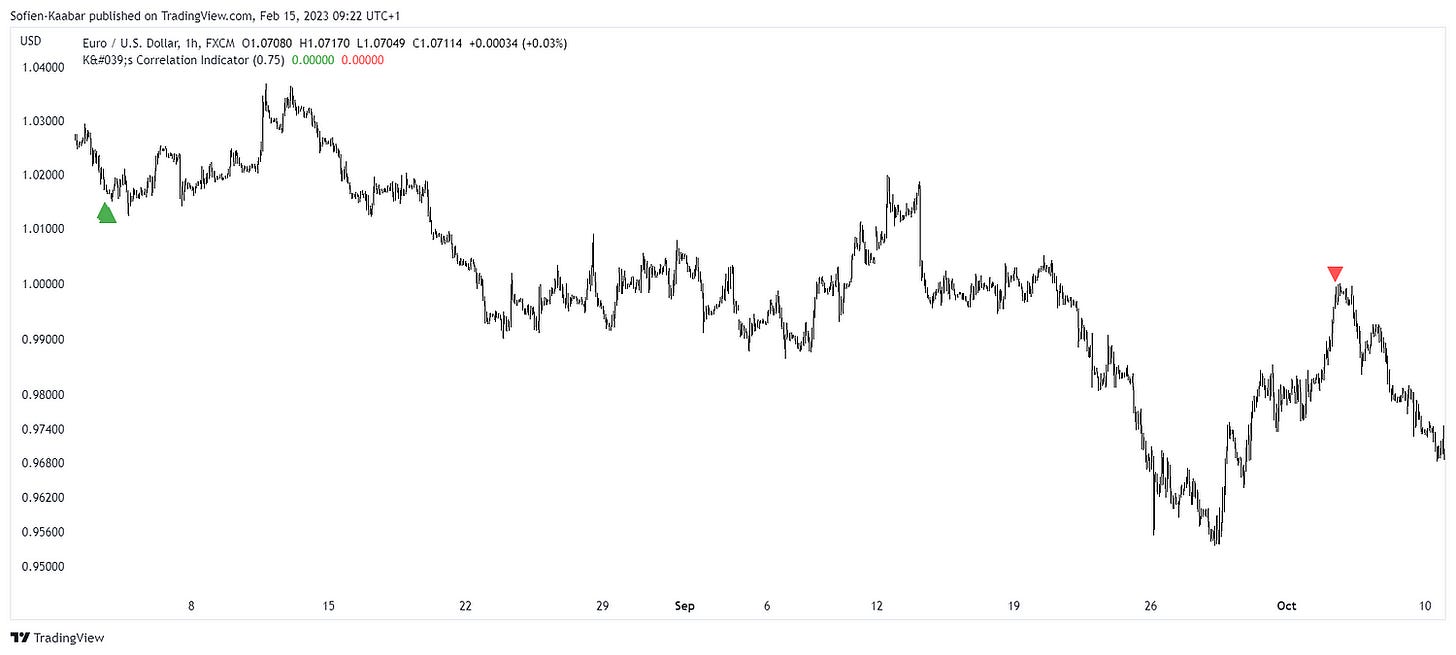
The following Figure shows a signal chart.
The following Figure shows another signal chart.
Summary
To sum up, what I am trying to do is to simply contribute to the world of objective technical analysis which is promoting more transparent techniques and strategies that need to be back-tested before being implemented. This way, technical analysis will get rid of the bad reputation of being subjective and scientifically unfounded.
I recommend you always follow the the below steps whenever you come across a trading technique or strategy:
Have a critical mindset and get rid of any emotions.
Back-test it using real life simulation and conditions.
If you find potential, try optimizing it and running a forward test.
Always include transaction costs and any slippage simulation in your tests.
Always include risk management and position sizing in your tests.
Finally, even after making sure of the above, stay careful and monitor the strategy because market dynamics may shift and make the strategy unprofitable.


