


Use This Indicator to Follow the Trend
Creating and Coding the Smoothed Normalized ATR Indicator


Volatility indicators are helpful in detecting trends. This article shows how to transform the ATR into a directional indicator and create a strategy out of it.
Creating the Smoothed Normalized ATR (SNATR)
The Average True Range (ATR) is a technical analysis indicator that measures volatility in financial markets. It was introduced by J. Welles Wilder Jr. in his 1978 book, “New Concepts in Technical Trading Systems.” The ATR calculates the average of a security’s true range over a specified period, usually 14 days. The true range is the greatest of the following:
The current period’s high minus the current period’s low.
The absolute value of the current period’s high minus the previous period’s close.
The absolute value of the current period’s low minus the previous period’s close.
The ATR is the smoothed moving average of the true range calculations. By using these three values, the ATR measures the volatility of a security over a certain time period, taking into account any gaps or price movements that occur between periods. Traders can use the ATR to determine the potential size of price movements and adjust their trading strategies accordingly. For example, a high ATR value may indicate that a security is more volatile and therefore riskier to trade.
The SNATR is a simple transformation of the ATR to make it bounded. The steps to calculate it are as follows:
Calculate the ATR of a financial instrument using whichever lookback period required.
Normalize the ATR between 0 and 1 using the basic normalization function defined below:

Calculate a 13-period weighted moving average on the normalized values from the previous step.
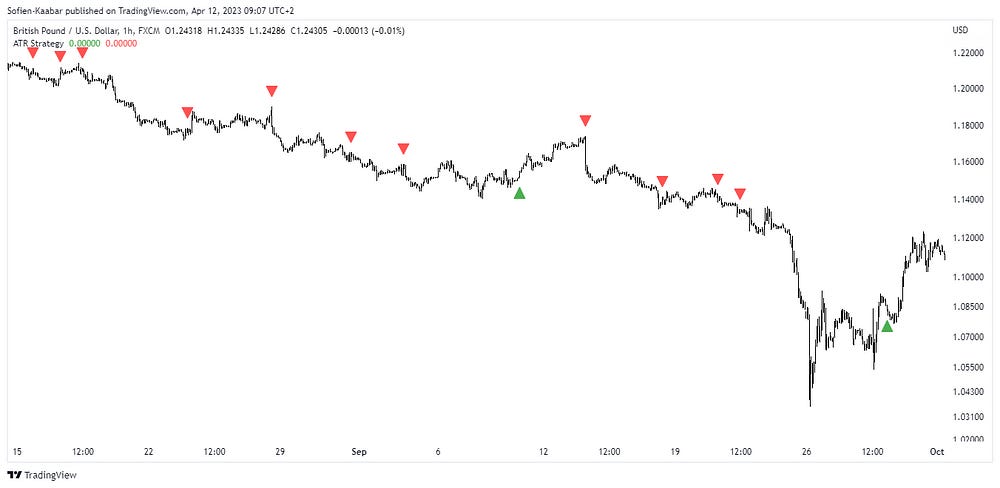
The following Figure shows the SNATR in action:

Do you want to master Deep Learning techniques tailored for time series, trading, and market analysis🔥? My book breaks it all down from basic machine learning to complex multi-period LSTM forecasting while going through concepts such as fractional differentiation and forecasting thresholds. Get your copy here 📖!
Coding the Strategy
Bear in mind that the presented strategy has default parameters that must be optimized for each market (while incorporating the risk of overfitting), therefore, it may not work well on all markets. You should take the idea of the strategy and try to make it better.
Trend following generally two theoretical ideas:
The first idea is that bullish trends generally have low volatility, therefore, if we can predict lower values on the ATR, we may be entering a bullish trend.
The second idea is that bearish trends generally have high volatility, therefore, if we can predict higher values on the ATR, we may be entering a bearish trend.
The strategy tries to predict a reversal on the SNATR the moment it shows a return to normality while at the same time a moving average filter confirms this. Below are the trading conditions:
A long signal is generated whenever the SNATR dips below 0.80 while the close price is above the 100-period moving average
A short signal is generated whenever the SNATR rises above 0.20 while the close price is below the 100-period moving average.
The code for the strategy is as follows:
// This source code is subject to the terms of the Mozilla Public License 2.0 at https://mozilla.org/MPL/2.0/
// © Sofien-Kaabar

//@version=5
indicator("ATR Strategy", overlay = true)

atr = ta.atr(60)
normalized_atr = (atr - ta.lowest(atr, 60)) / ((ta.highest(atr, 60)) - ta.lowest(atr, 60))
smoothed_normalized_atr = ta.wma(normalized_atr, 13)

buy  = smoothed_normalized_atr < 0.8 and smoothed_normalized_atr[1] > 0.8 and close > ta.sma(close, 100)
sell = smoothed_normalized_atr > 0.2 and smoothed_normalized_atr[1] < 0.2 and close < ta.sma(close, 100)

plotshape(buy,  style = shape.triangleup, color = color.green, location =  location.belowbar, size = size.small)
plotshape(sell,  style = shape.triangledown, color = color.red, location =  location.abovebar, size = size.small)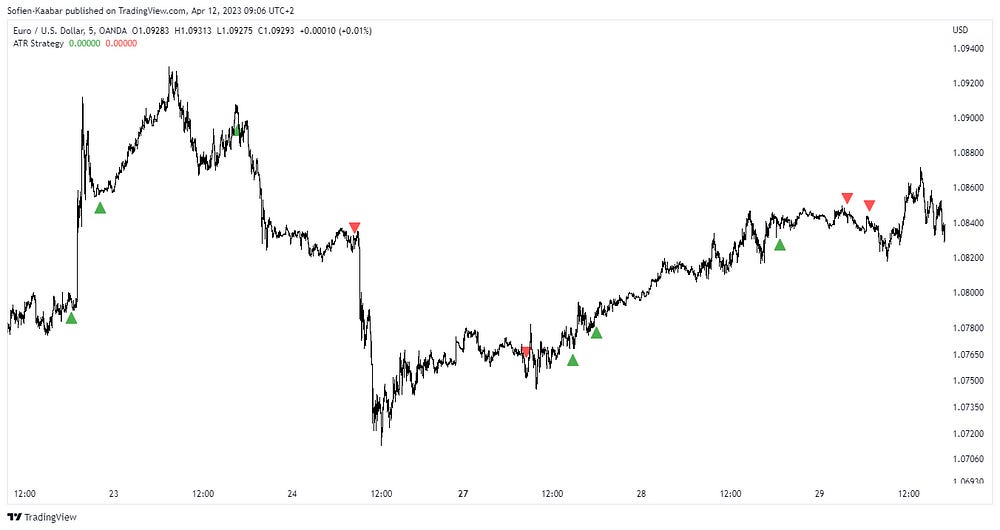
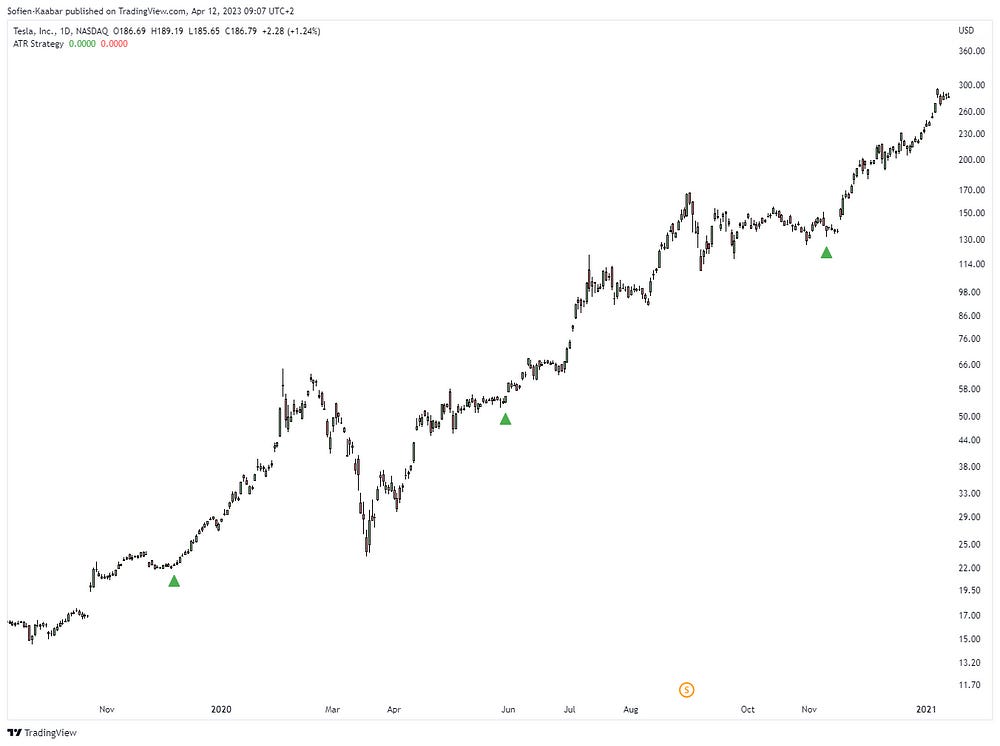
The following Figure shows another signal chart on Tesla:
Summary
To sum up, what I am trying to do is to simply contribute to the world of objective technical analysis which is promoting more transparent techniques and strategies that need to be back-tested before being implemented. This way, technical analysis will get rid of the bad reputation of being subjective and scientifically unfounded.
I recommend you always follow the the below steps whenever you come across a trading technique or strategy:
Have a critical mindset and get rid of any emotions.
Back-test it using real life simulation and conditions.
If you find potential, try optimizing it and running a forward test.
Always include transaction costs and any slippage simulation in your tests.
Always include risk management and position sizing in your tests.
Finally, even after making sure of the above, stay careful and monitor the strategy because market dynamics may shift and make the strategy unprofitable.
Every week, I analyze positioning, sentiment, and market structure. Curious what hedge funds, retail, and smart money are doing each week? Then join hundreds of readers here in the Weekly Market Sentiment Report 📜 and stay ahead of the game through chart forecasts, sentiment analysis, volatility diagnosis, and seasonality charts.
Free trial available🆓
