Understand Market Reversals Using Moving Averages
Transforming Classic Technical Indicators Into Modern Tools
Moving averages are a staple in technical analysis, which is basically about studying past market data to predict future price movements. Moving averages smooth out price data to help identify trends over time. This article presents moving averages and a way to use them to identify the end of a trend instead of confirming it.
A Quick Introduction to Moving Averages in Technical Analysis
Here’s how moving averages work, imagine you’re tracking the price of a stock over the past 50 days. Instead of just looking at each day’s price, you calculate the average price over those 50 days. As each new day’s data comes in, you drop the oldest day’s price from the calculation and add the newest one. This moving average gives you a clearer picture of the overall trend.
Traders use moving averages in various ways. For example, when the current price crosses above its moving average, it might signal an uptrend, while a cross below could indicate a downtrend. Some traders also use multiple moving averages of different lengths to spot trend changes more reliably.
The following chart shows a 200-day moving average applied on the daily values of BTCUSD:
Overall, moving averages are a handy tool for traders to filter out noise and identify trends in market data, helping them make more informed decisions about when to buy or sell assets.
If you want to see more of my work, you can visit my website for the books catalogue by simply following the link attached the picture:
Using Moving Averages as Contrarian Indicators
The main usage of moving averages is to understand and confirm the trend. This means that they have the following default way of usage:
The market is in a bullish (rising) regime whenever it is above its moving average.
The market is in a bearish (falling) regime whenever it is below its moving average.
However, we can also use the distance between the moving average and the price as a tool to forecast short-term reversals.
We will create a technical indicator that we will call the Moving Average Reversal Indicator (MARI). It will be constructed through the following steps:
Calculate a 200-period moving average on the price.
Subtract the price from the moving average. Let’s call this the distance.
Normalize the distance between 0 and 1.
Now, to create the reversal (contrarian) signals, follow this logic:
A bullish signal is generated whenever the normalized distance rises from zero after having spent one period equal to zero.
A bearish signal is generated whenever the normalized distance drops from one after having spent one period equal to one.
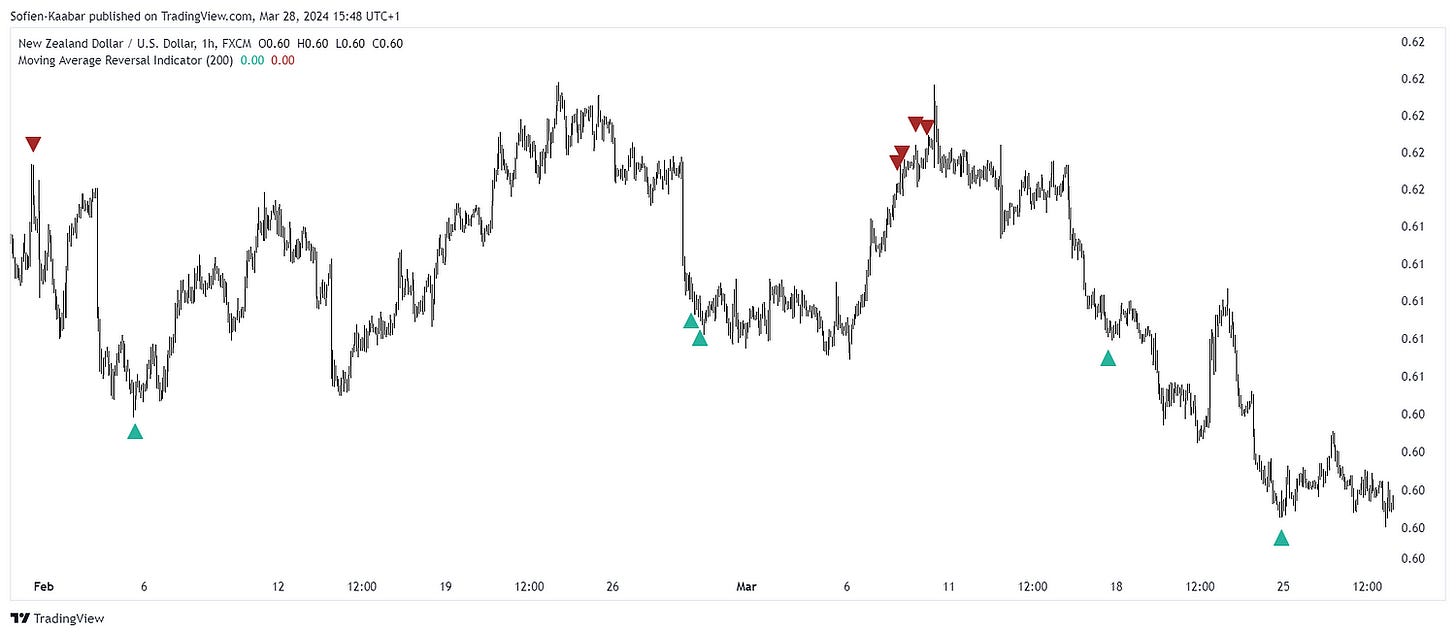
The following chart shows the signals generated using the above conditions:
Use the following code to implement the MARI using Pine Script for TradingView:
//@version=5
indicator("Moving Average Reversal Indicator", overlay = true)

ma_length = input(200, title = "Moving Average Length")
sma_value = ta.sma(close, ma_length)

distance = close - sma_value
distance_normalized = (distance - ta.lowest(distance, 200)) / (ta.highest(distance, 200) - ta.lowest(distance, 200))

bullish_signal = distance_normalized > 0 and distance_normalized[1] == 0 and distance_normalized[2] > 0
bearish_signal = distance_normalized < 1 and distance_normalized[1] == 1 and distance_normalized[2] < 1

plotshape(bullish_signal,  style = shape.triangleup, color = color.rgb(41, 180, 157), location =  location.belowbar, size = size.small)
plotshape(bearish_signal,  style = shape.triangledown, color = color.rgb(165, 42, 42), location =  location.abovebar, size = size.small)

if bullish_signal
    alert("Bullish Signal detected!).", alert.freq_once_per_bar)

if bearish_signal
    alert("Bearish Signal detected!).", alert.freq_once_per_bar)
The following chart shows more signals from the indicator:
Technical indicators, while useful for analyzing market trends, have several pitfalls. These include their lagging nature, often producing signals after the market has moved; the risk of overfitting, where indicators may fit historical data too closely and perform poorly in real-world trading; the prevalence of false signals, particularly in choppy markets; subjectivity in interpretation, leading to conflicting signals among traders; the challenge of filtering out market noise and distinguishing genuine trends; limited information, as indicators typically only consider price and volume data; the danger of overreliance, and so on and so forth.
You can also check out my other newsletter The Weekly Market Sentiment Report that sends tactical directional views every weekend to highlight the important trading opportunities using a mix between sentiment analysis (COT reports, Put-Call ratio, Gamma exposure index, etc.) and technical analysis.


