Tweaking the RSI in Search for Better Signals
A Simple Modification on the RSI to Find New Uncorrelated Signals
The RSI is a great technical tool during ranging markets, but in trending markets it tends to underperform. Every indicator has its weakness. This article tries to weigh a few RSI’s together to deliver a more complete picture.
The Fibonacci Trading Book is finally out! Filled with Fibonacci-based trading methods (tools, indicators, patterns, and strategies), this book will guide you through improving your trading and analysis by incorporating an important technical analysis approach that is Fibonacci. (Link to pay in PayPal for the PDF version at the end of the article)
The Relative Strength Index (RSI)
RSI stands for Relative Strength Index, which is a technical analysis indicator used to measure the momentum of a financial asset such as a stock, commodity, or currency pair. The RSI is calculated using the average gain and loss of an asset’s closing prices over a specified period of time, typically 14 days.
The RSI value ranges from 0 to 100, with a reading above 70 indicating an overbought condition, and a reading below 30 indicating an oversold condition. Traders and analysts use the RSI to identify potential buy and sell signals.
To use the RSI, traders typically look for divergences between the price action and the RSI, which can indicate a potential reversal in trend. For example, if a stock is making lower lows but the RSI is making higher lows, it may be a bullish divergence and a signal to consider buying the stock. Conversely, if a stock is making higher highs but the RSI is making lower highs, it may be a bearish divergence and a signal to consider selling the stock.
It’s important to note that the RSI should be used in conjunction with other technical indicators and fundamental analysis to make trading decisions. It’s also important to consider the timeframe being analyzed, as the RSI can give different signals on different timeframes.
A Simple Comparison
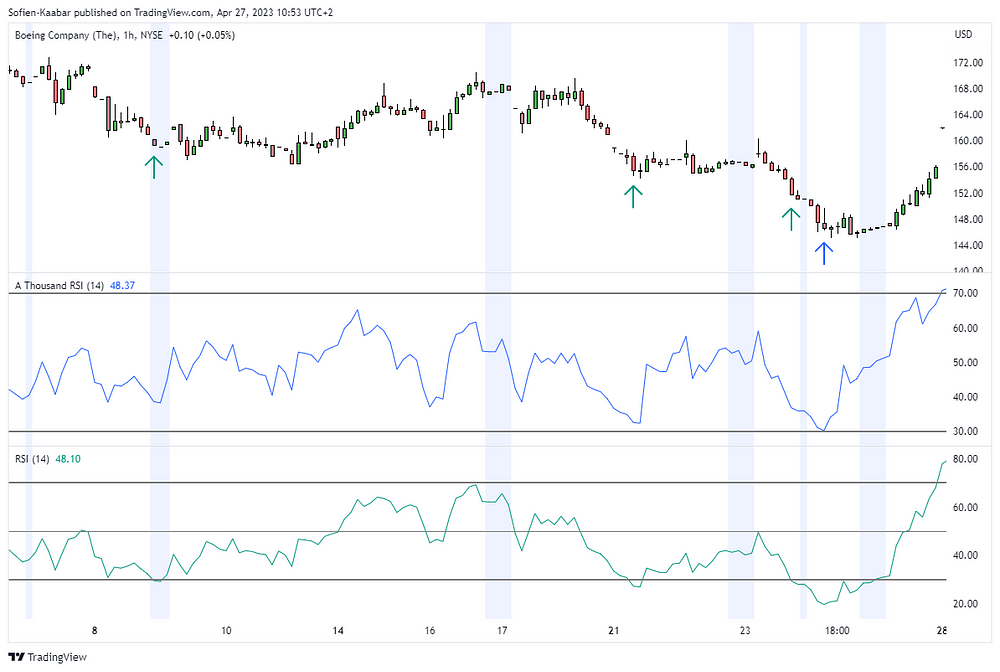
Both indicator are correlated but sometimes do not show the same signals. Empirically, it looks like the regular RSI is a bit fast to show a signal as opposed to the average RSI. In blue (and top) is the averaged RSI and in green (and bottom) is the regular RSI. Their signals are shown through the arrows using their respective colors.
The next Figure shows another signal chart.
The code for the averaged RSI is as follows:
// This source code is subject to the terms of the Mozilla Public License 2.0 at https://mozilla.org/MPL/2.0/
// © Sofien-Kaabar

//@version=5
indicator("Averaged RSI")

lookback = input(defval = 14, title = 'Lookback')

rsi_prime  = ta.rsi(close, lookback)
rsi_second = ta.rsi(rsi_prime, lookback)
rsi_third  = ta.rsi(rsi_second, lookback)
rsi_fourth = ta.rsi(rsi_third, lookback)
rsi_fifth  = ta.rsi(rsi_fourth, lookback)
rsi_sixth  = ta.rsi(rsi_fifth, lookback)

a_thousand_rsi = (0.25 * rsi_prime) +
                 (0.15 * rsi_second) +
                 (0.15 * rsi_third) +
                 (0.15 * rsi_fourth) +
                 (0.15 * rsi_fifth) +
                 (0.15 * rsi_sixth)

hline(50)
hline(30)
hline(70)

plot(a_thousand_rsi, color = a_thousand_rsi < 70 or a_thousand_rsi > 30? color.black:color.blue)Clearly, both sometimes have false signals in heavily trending markets. However, the advantage of the averaged RSI is that it rarely sticks to oversold and overbought areas and also rarely touches them multiple times as can be seen on the RSI.
Divergence signals can also be detected on the averaged RSI which would not be on the normal RSI. This works both ways of course but it’s always interesting to have a second opinion. The ideal outcome is to have a divergence confirmed on both indicators.
As a reminder, A bullish divergence occurs when the price of an asset is making lower lows while the indicator is making higher lows. This suggests that the momentum of the price decline is weakening and that a reversal to the upside may be imminent.
On the other hand, a bearish divergence occurs when the price of an asset is making higher highs while the indicator is making lower highs. This indicates that the momentum of the price increase is weakening and that a reversal to the downside may be imminent.


