
Trend Following Mastery With The SuperTrend Complex Strategy
Following the Trend With a Sophisticated Trading Strategy

In this article, we’ll explore a powerful approach that combines two popular indicators — the Supertrend and the Relative Strength Index (RSI). This trend-following strategy aims to provide traders with a practical and dynamic method for identifying trends and potential entry or exit points in the market.
The SuperTrend, The RSI, and Co.
The Supertrend is designed to help identify the direction of an asset’s trend. In simple terms, it tells you whether the market is in an uptrend or downtrend.
The Supertrend is plotted on the price chart and consists of two lines: one indicating the trend’s direction (up or down) and the other representing the stop-loss level. When the trend line is below the price, it suggests an uptrend, and when it’s above, it signals a downtrend.
The stop-loss line is crucial because it helps traders set dynamic stop-loss levels. If the price crosses the stop-loss line, it may indicate a potential reversal in the trend. Traders often use this information to make decisions about entering or exiting positions.
It’s a handy tool for those looking to ride trends and manage risk effectively. Keep in mind that while the Supertrend can be a useful tool, like any indicator, it’s not foolproof and should be used in conjunction with other analysis methods for better decision-making.
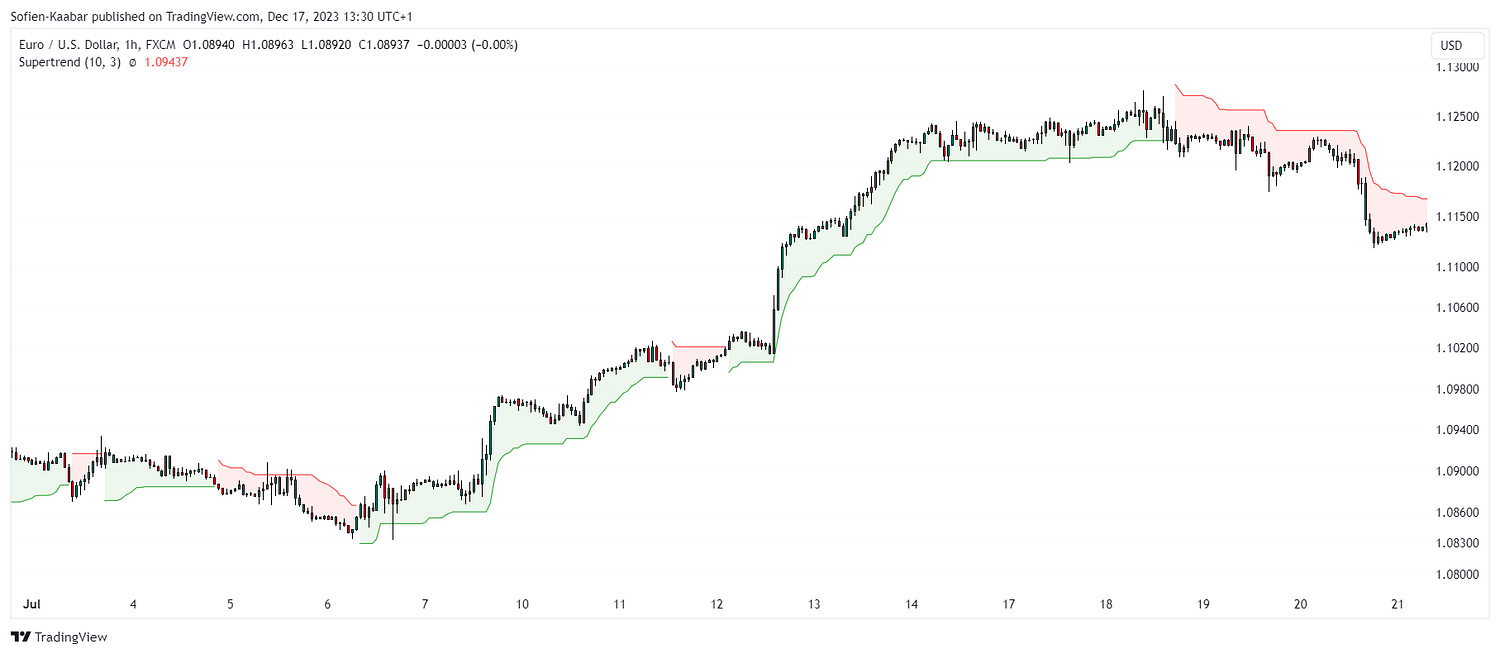
The ways to use the SuperTrend are as follows:
A bullish regime is taking place whenever the market is above the SuperTrend line.
A bearish regime is taking place whenever the market is below the SuperTrend line.
Now, let’s talk about the RSI. Imagine the RSI as a tool that helps you figure out if a stock or any other asset is overbought or oversold. It’s like trying to see if a party is too crowded or too empty.
The RSI measures the speed and change of price movements. When it’s high, like above 70, it suggests that the asset might be overbought. Think of it like everyone rushing in to buy the latest cool thing, and maybe it’s getting a bit too popular. On the flip side, if the RSI is low, below 30, it implies that the asset might be oversold. This is like when nobody wants to go to a party, and it might be a good time to check it out because things could pick up.
Now, why does this matter? Well, it gives you a hint about potential reversals in the market. If something is overbought, it might be time for a cool-down, and if it’s oversold, there might be a chance for a comeback. Traders often use RSI to get a sense of whether an asset is in a strong trend or if it’s about to change direction. So, in a nutshell, RSI is like a party meter for the market. It helps you gauge if things are getting too wild or if it’s a bit quiet, giving you a heads-up on potential changes in the market vibe.
A market regime is essentially the prevailing state or condition of the financial markets at a given time. It’s like saying the market can have different modes or phases, just like a person can be happy, sad, or somewhere in between.
Now, these market regimes can be broadly categorized based on trends. Imagine a market in a strong upward trend — everyone’s feeling optimistic, prices are going up, and it’s like a bull (that’s the term for a rising market) is running around.
On the flip side, if the market is in a downtrend, it’s like a bear (that’s the term for a falling market) is dominating. People might be a bit more cautious, prices are dropping, and it’s generally a less optimistic atmosphere.
The tricky part is that markets aren’t always in a clear-cut bull or bear state. Sometimes they’re just moving sideways, not going up or down much. That’s another market regime, often called a “sideways” or “range-bound” market.
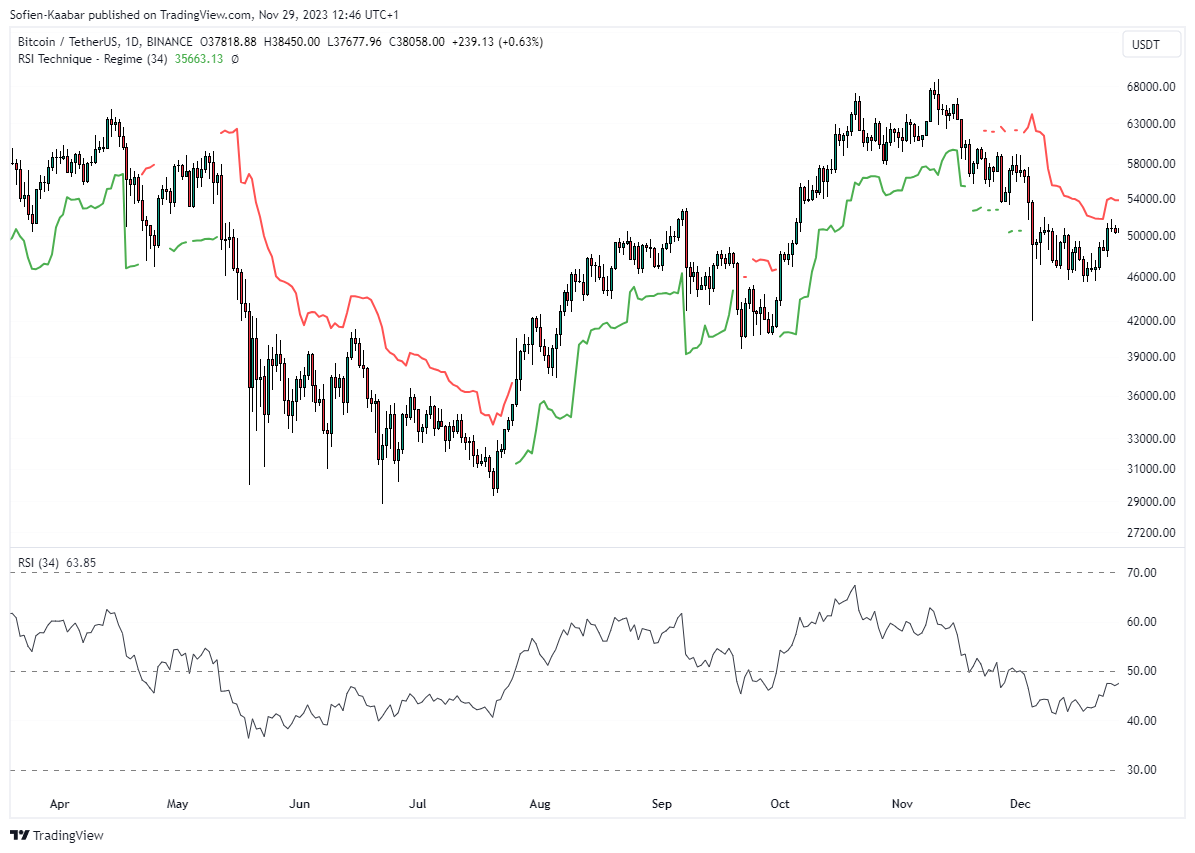
The conditions of the creation of the indicator follow these assumptions:
A bullish regime is taking place whenever the RSI is above 50 but below 75 while the last three RSI values were above 46.
A bearish regime is taking place whenever the RSI is below 50 but above 25 while the last three RSI values were below 54.
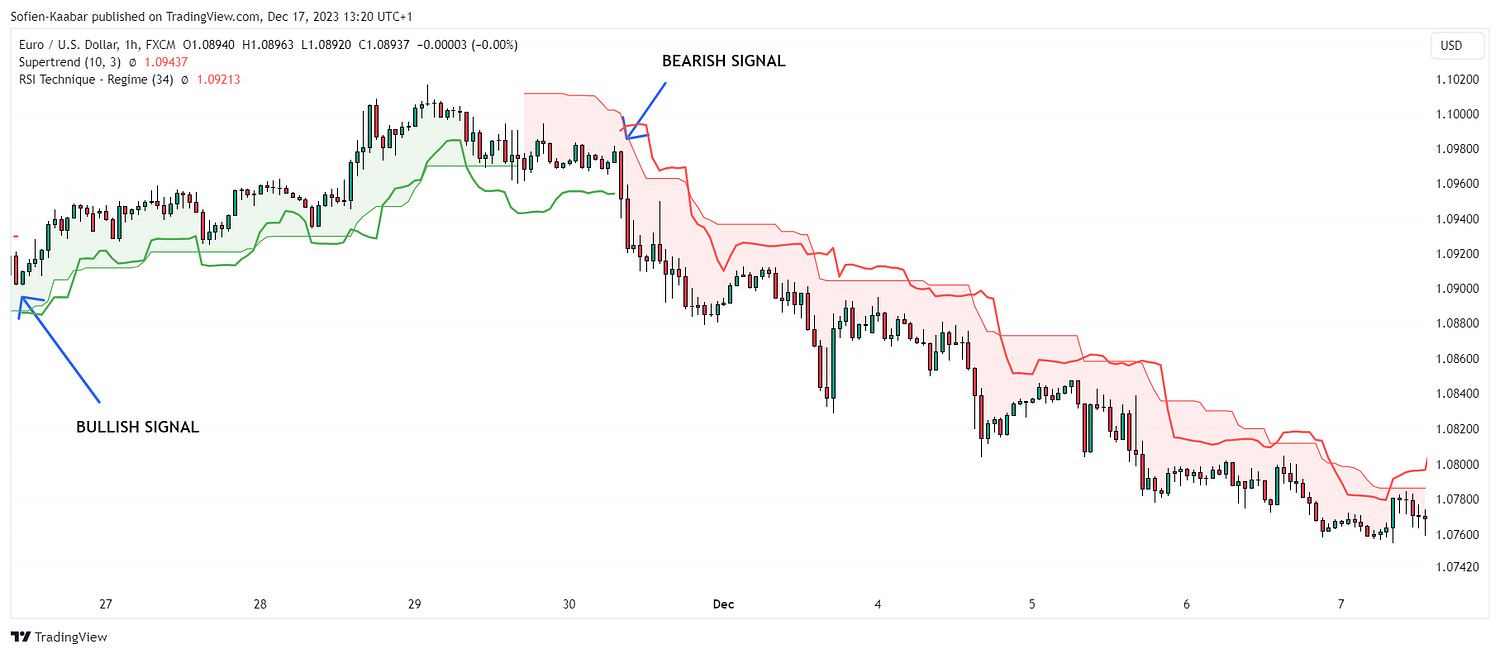
The conditions of the strategy are as follows:
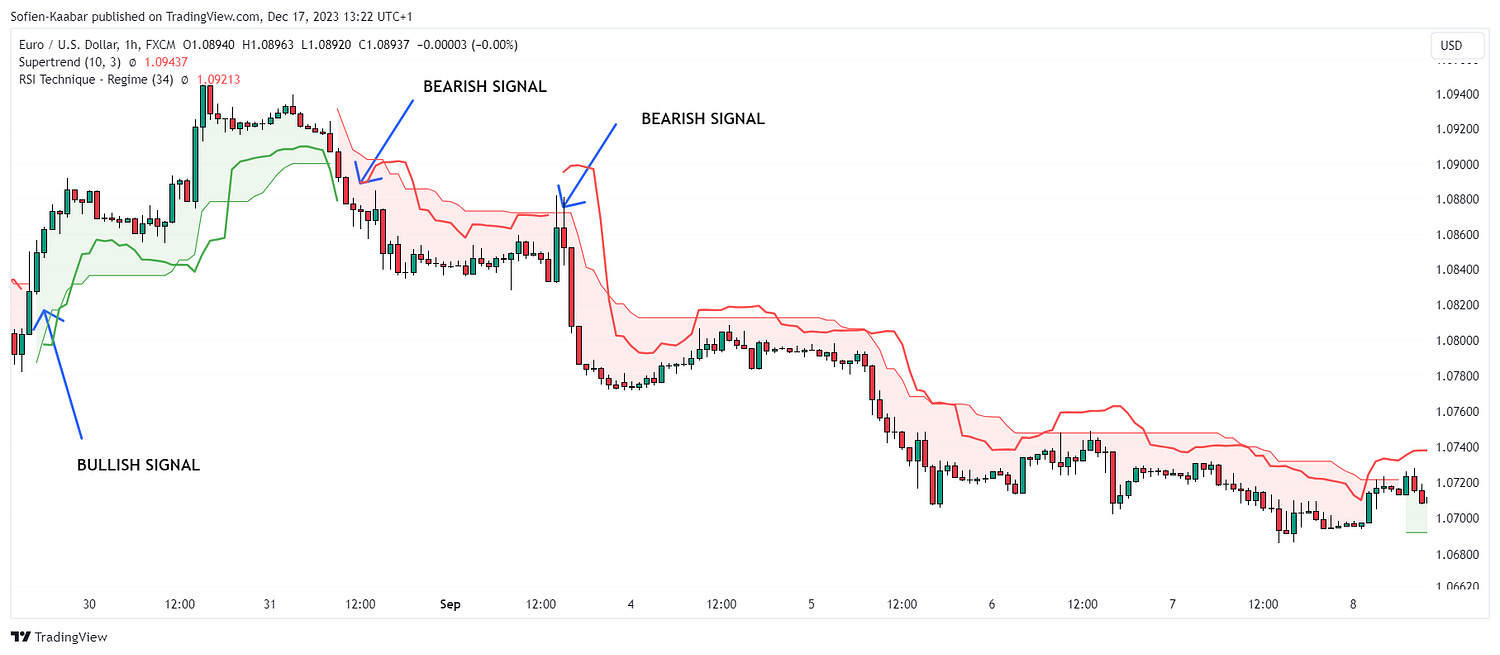
A bullish signal is generated whenever the market is above the SuperTrend line and the RSI regime line.
A bearish signal is generated whenever the market is below the SuperTrend line and the RSI regime line.
The following shows an example of a few signals.
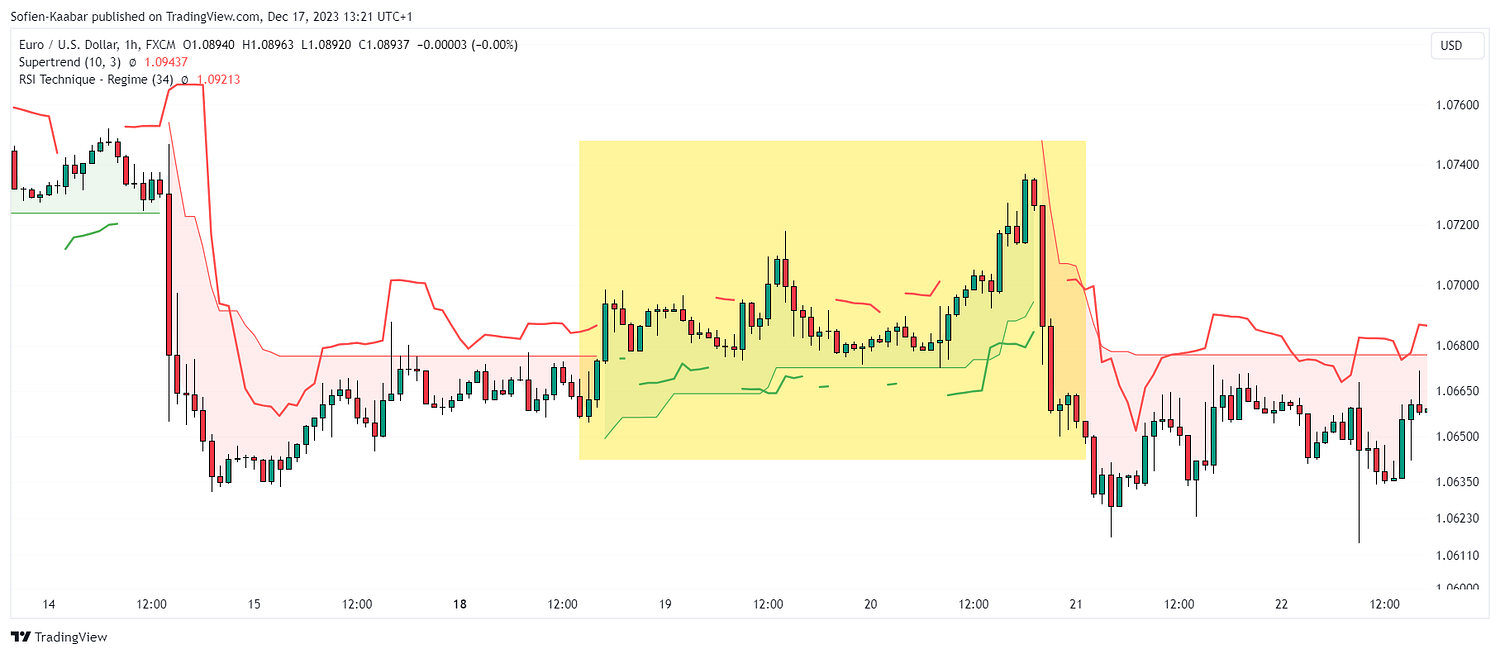
When markets are choppy, trend following techniques and strategies rarely do provide value such as the case in the following chart.
Do you want to master Deep Learning techniques tailored for time series, trading, and market analysis🔥? My book breaks it all down from basic machine learning to complex multi-period LSTM forecasting while going through concepts such as fractional differentiation and forecasting thresholds. Get your copy here 📖!
The Strategy in Action
Exiting a trade is as important as entering it, and this is why simple rules can be made with regards to closing out an ongoing trade. Naturally, one would think that if the market breaks one of the lines, this would mean that a risk of reversal may be in the horizon. Therefore, the closing conditions are as follows:
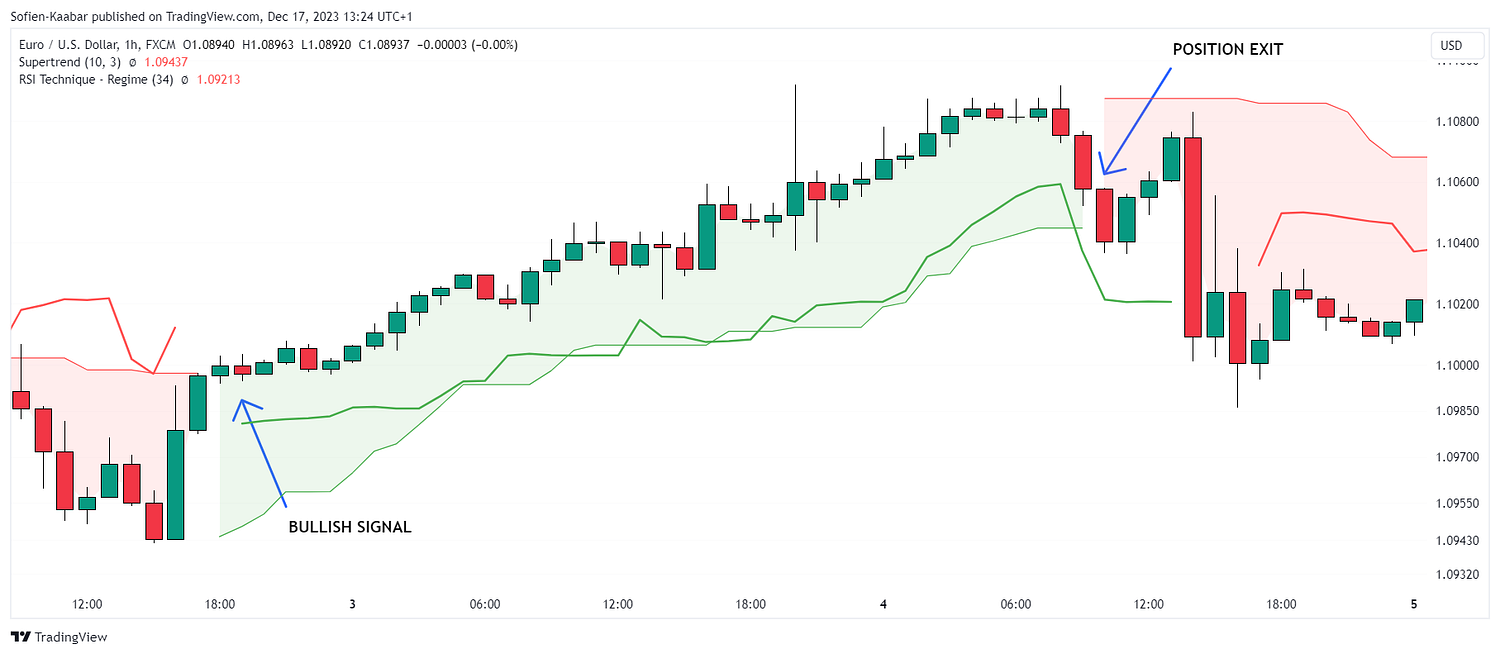
Exit the bullish position once the market breaks either of the lines.
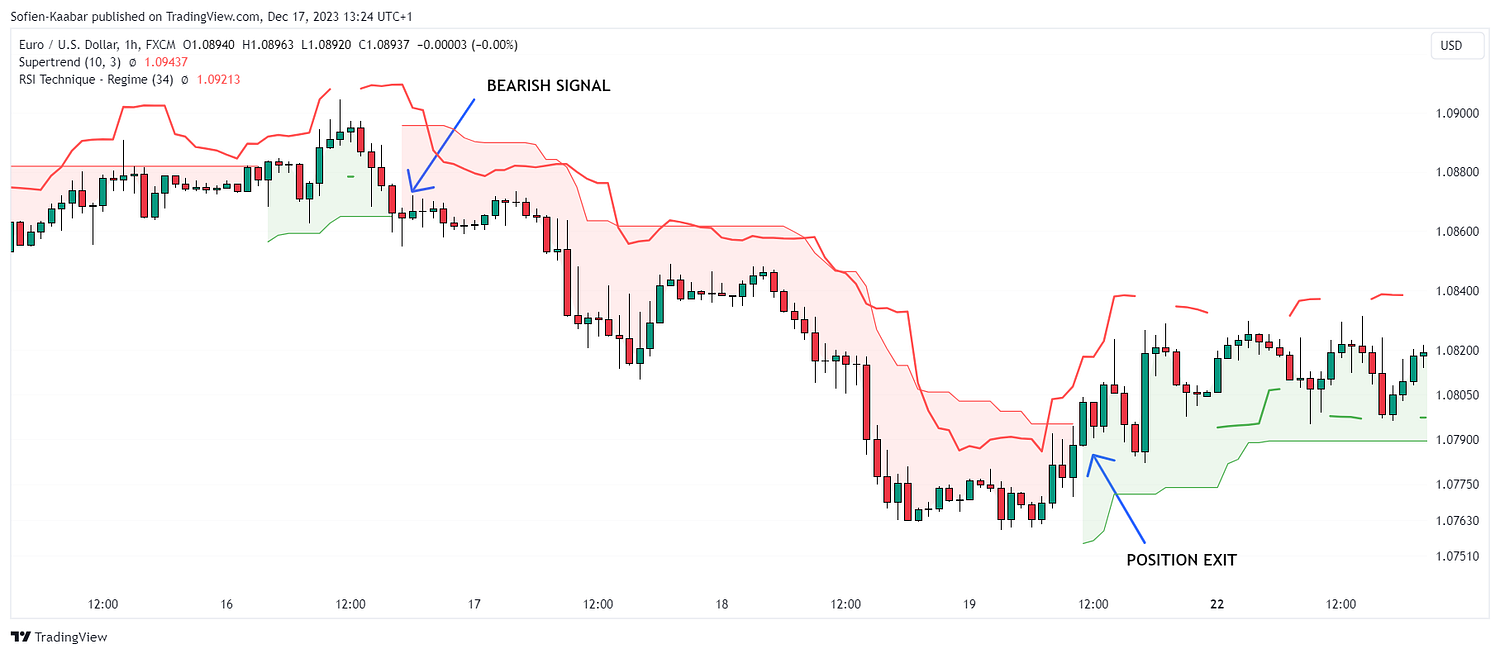
Exit the bearish position once the market surpasses either of the lines.
The following illustration shows how to exit a bullish trade.
The following illustration shows how to exit a bearish trade.
In summary, trading is a form of art, and combining the right indicators and techniques is important for success.
✨ The Weekly Market Sentiment Report is evolving into The Signal Beyond 🚀.
This isn’t just a sentiment check anymore. It’s becoming a full market intelligence package with expanded technical scorecards, refined sentiment models, and machine learning forecasts. From classic tools that have stood the test of time to fresh innovations like multi-market RSI heatmaps, volatility regime dashboards, and pairs trading recommendation system, the new report is designed to give you a sharper edge in navigating the markets.
Free trial available.