Ichimoku Kinko Hyo, often referred to simply as Ichimoku, is a comprehensive technical analysis system designed to gauge market trends, momentum, support, and resistance levels. It originated in Japan and translates to one glance equilibrium chart, emphasizing its ability to offer a holistic view of price action.
This article will give you everything you need to know about this system and how to code it in Python
History and Origins
Ichimoku Kinko Hyo was developed by a Japanese journalist named Goichi Hosoda in the late 1930s but wasn’t widely introduced until the late 1960s. His goal was to create a one-glance system that could quickly and effectively identify trends and potential trading signals.
The system was designed not just for short-term speculation but also to offer insight into longer-term market dynamics.
Components of Ichimoku Kinko Hyo
Ichimoku consists of five main lines or components that work together to provide a detailed picture of market conditions:
Tenkan-sen / Conversion line
Calculated as the average between the highest high and the lowest low of the last 9 periods, this is a short-term indicator, similar to a moving average, but it reflects the midpoint of the price over the last 9 periods (default setting). It helps in identifying short-term trends.
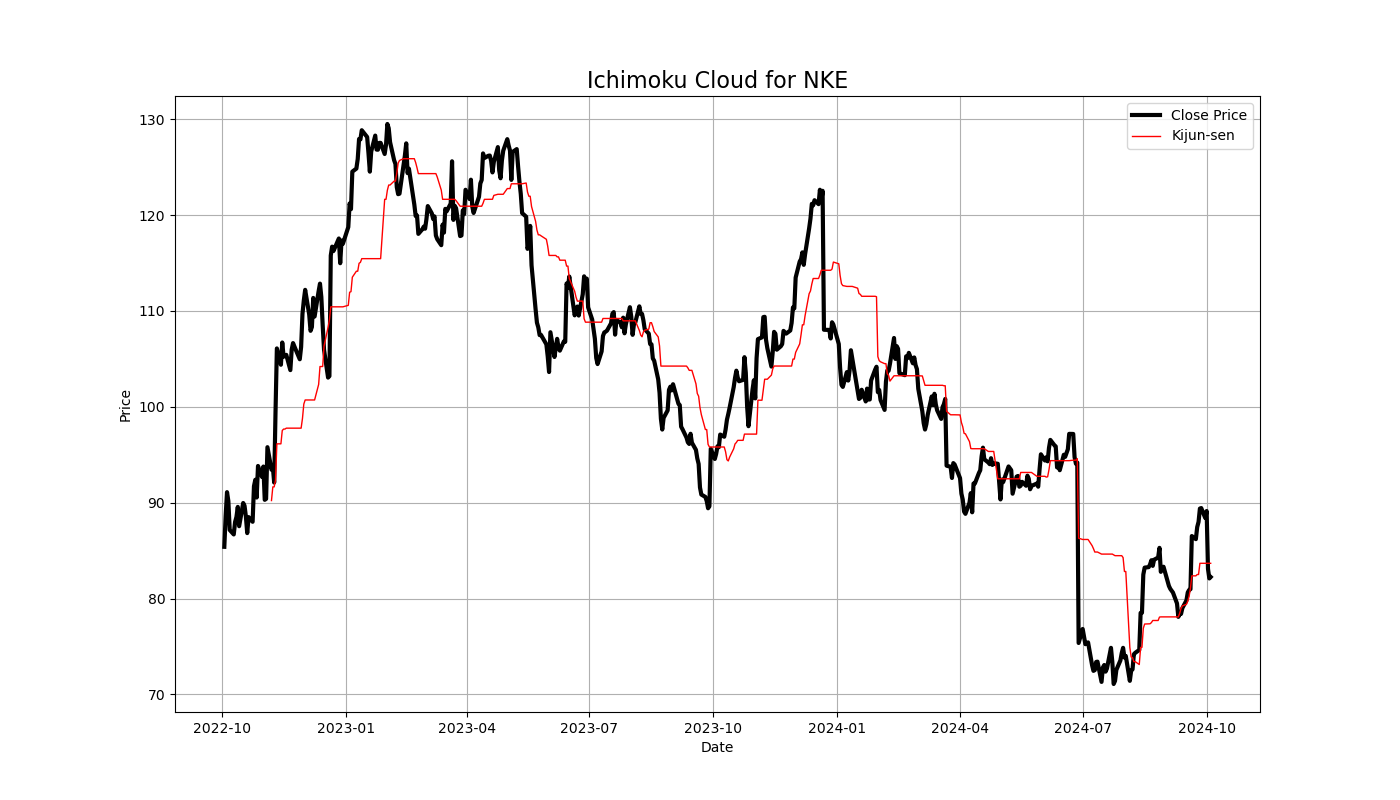
Kijun-sen / Base line
Calculated as the average between the highest high and the lowest low of the last 26 periods. The Kijun-sen shows the overall trend and acts as a support or resistance line. It is more significant than the Tenkan-sen and can also be used to gauge market momentum.
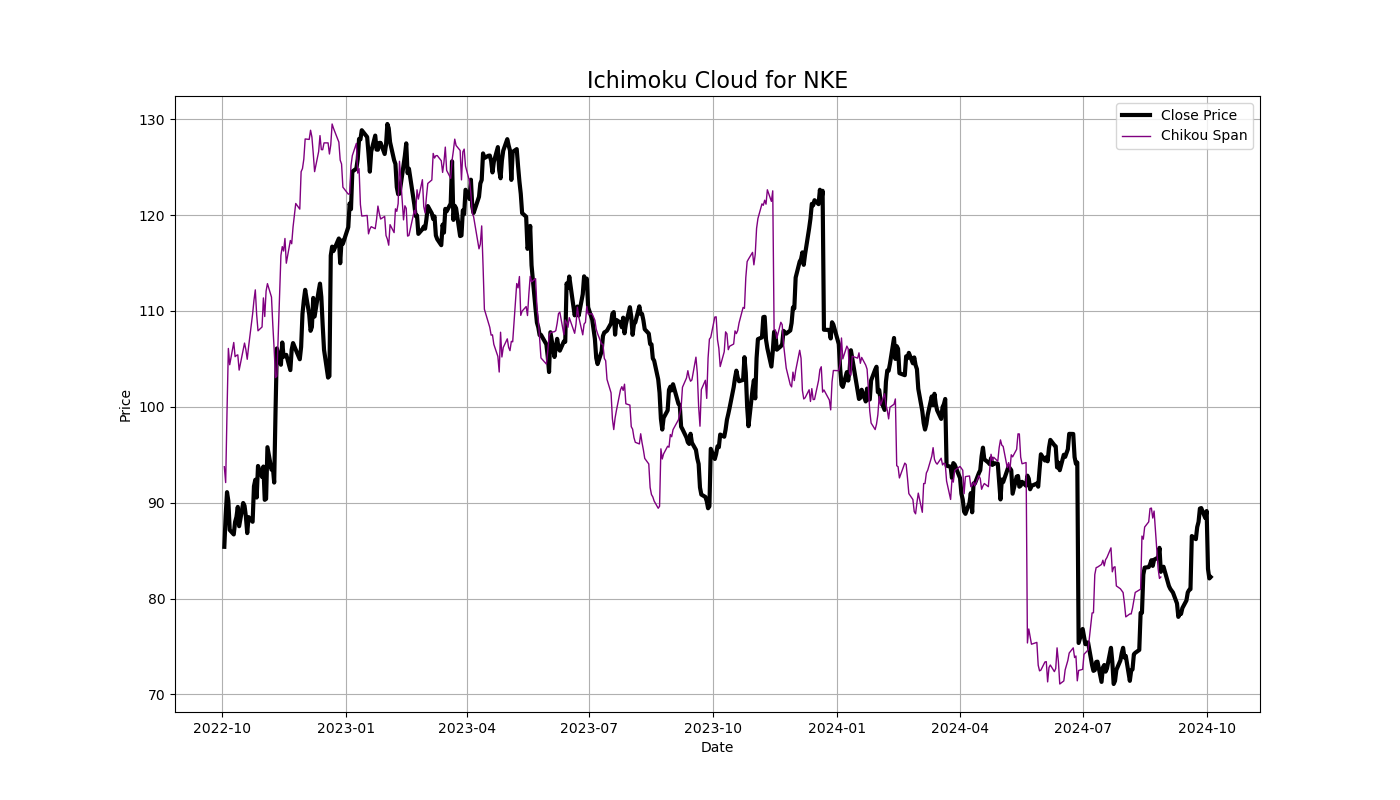
Chikou Span / Lagging Span
Calculated as the current closing price, plotted 26 periods into the past. This line is used to confirm trends. If the Chikou span is above price action, it confirms bullish momentum, while being below price action indicates bearish momentum.
Senkou Span A / Leading span A
Calculated as the average between the Tenkan-sen an the Kijun-sen plotted 26 periods ahead. One of the two boundaries of the Kumo (Cloud). This line represents the midpoint between the Tenkan-sen and Kijun-sen, projected 26 periods into the future. It shows potential future support and resistance zones.
Senkou Span B / Leading span B
Calculated as the average between the highest high and the lowest low) for the last 52 periods, plotted 26 periods ahead. This is the second boundary of the Kumo. It provides a more significant long-term view compared to Senkou Span A and is also plotted 26 periods into the future. The distance between Span A and Span B forms the Kumo (Cloud).
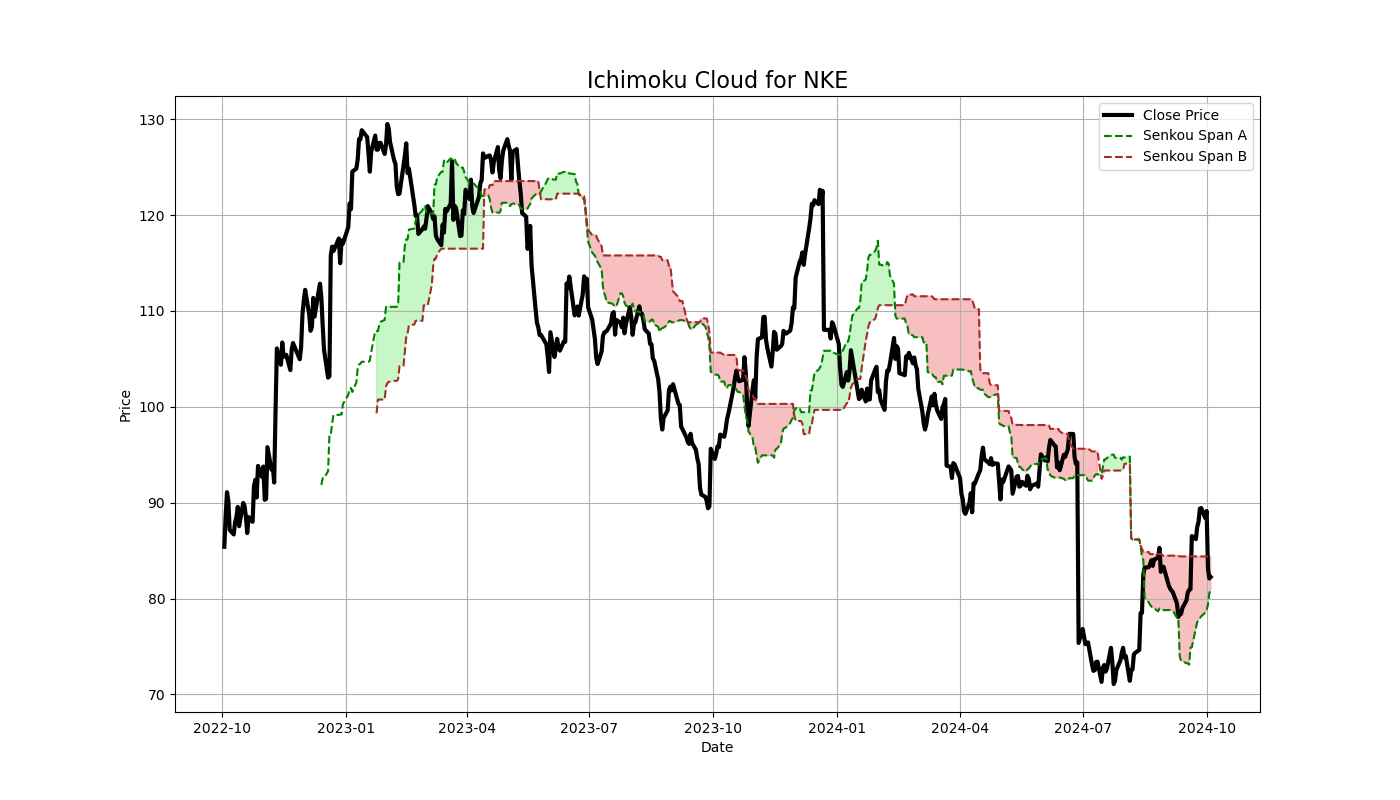
The Kumo, formed by Senkou Span A and Senkou Span B, is arguably the most important and distinctive feature of the Ichimoku system. It provides insight into future support and resistance levels, as well as the overall market trend. The cloud changes color based on which of the two spans is higher, and its thickness represents the strength of the support or resistance.
Bullish Kumo: When Senkou Span A is above Senkou Span B.
Bearish Kumo: When Senkou Span B is above Senkou Span A.
The thickness of the Kumo reflects market volatility, with a thicker cloud indicating stronger support or resistance and a thinner cloud suggesting weaker levels.
The following code allows you to create the full Ichimoku system using Python:
import yfinance as yf
import matplotlib.pyplot as plt

# Download historical data for AAPL (Apple)
ticker = 'NKE'
df = yf.download(ticker, start="2022-10-01", end="2024-10-06")

# Display the data
df.head()

# 1. Tenkan-sen (Conversion Line)
high_9 = df['High'].rolling(window=9).max()
low_9 = df['Low'].rolling(window=9).min()
df['Tenkan_sen'] = (high_9 + low_9) / 2

# 2. Kijun-sen (Base Line)
high_26 = df['High'].rolling(window=26).max()
low_26 = df['Low'].rolling(window=26).min()
df['Kijun_sen'] = (high_26 + low_26) / 2

# 3. Senkou Span A (Leading Span A) - Midpoint of Tenkan-sen and Kijun-sen
df['Senkou_span_A'] = ((df['Tenkan_sen'] + df['Kijun_sen']) / 2).shift(26)

# 4. Senkou Span B (Leading Span B) - 52-period high-low midpoint
high_52 = df['High'].rolling(window=52).max()
low_52 = df['Low'].rolling(window=52).min()
df['Senkou_span_B'] = ((high_52 + low_52) / 2).shift(26)

# 5. Chikou Span (Lagging Span) - Close shifted 26 periods back
df['Chikou_span'] = df['Close'].shift(-26)

# Display the Ichimoku components
df[['Tenkan_sen', 'Kijun_sen', 'Senkou_span_A', 'Senkou_span_B', 'Chikou_span']].tail(30)

plt.figure(figsize=(14, 8))

# Plot closing price
plt.plot(df.index, df['Close'], label='Close Price', color='black', linewidth=3)

# Plot Tenkan-sen
plt.plot(df.index, df['Tenkan_sen'], label='Tenkan-sen', color='blue', linewidth=1)

# Plot Kijun-sen
plt.plot(df.index, df['Kijun_sen'], label='Kijun-sen', color='red', linewidth=1)

# Plot Senkou Span A
plt.plot(df.index, df['Senkou_span_A'], label='Senkou Span A', color='green', linestyle='--')

# Plot Senkou Span B
plt.plot(df.index, df['Senkou_span_B'], label='Senkou Span B', color='brown', linestyle='--')

# Fill the area between Senkou Span A and B (Cloud)
plt.fill_between(df.index, df['Senkou_span_A'], df['Senkou_span_B'],
                 where=df['Senkou_span_A'] >= df['Senkou_span_B'], color='lightgreen', alpha=0.5)

plt.fill_between(df.index, df['Senkou_span_A'], df['Senkou_span_B'],
                 where=df['Senkou_span_A'] < df['Senkou_span_B'], color='lightcoral', alpha=0.5)

# Plot Chikou Span
plt.plot(df.index, df['Chikou_span'], label='Chikou Span', color='purple', linewidth=1)

# Customize the plot
plt.title(f'Ichimoku Cloud for {ticker}', fontsize=16)
plt.xlabel('Date')
plt.ylabel('Price')
plt.legend(loc='best')
plt.grid(True)

# Show the plot
plt.show()
Putting all the elements of the system together yields the following chart.
Trading Signals with Ichimoku Kinko Hyo
There are many trading techniques to use with Ichimoku, and some build up on the others. Let’s discuss a few.
Tenkan-sen / Kijun-sen Cross
Bullish signal: When the Tenkan-sen crosses above the Kijun-sen, it’s a buy signal.
Bearish signal: When the Tenkan-sen crosses below the Kijun-sen, it’s a sell signal.
The strength of this signal depends on where it occurs relative to the Kumo:
Strong signal: Cross occurs above the Kumo (for bullish signals) or below the Kumo (for bearish signals).
Neutral signal: Cross occurs inside the Kumo.
Weak signal: Cross occurs below the Kumo (for bullish signals) or above the Kumo (for bearish signals).
Price and Kumo Relationship
Above the Kumo: When the price is above the cloud, the market is in an uptrend.
Below the Kumo: When the price is below the cloud, the market is in a downtrend.
Inside the Kumo: The market is in consolidation, and the trend is unclear.
Chikou Span Confirmation
The Chikou span, also known as the lagging line, is often used to confirm signals. For instance, if a bullish Tenkan/Kijun cross occurs, and the Chikou span is above price action, it confirms the upward momentum and strengthens the buy signal. If the Chikou span is below price action, it weakens the bullish signal.
Kumo Breakouts
Bullish breakout: When price breaks out above the Kumo, it’s a strong buy signal, especially if the Kumo is thin, indicating weaker resistance.
Bearish breakout: When price breaks below the Kumo, it’s a sell signal, especially if the Kumo is thin, indicating weaker support.
Characteristics of Ichimoku Kinko Hyo
Ichimoku provides a comprehensive view of the market at a glance, combining trend identification, support/resistance levels, and momentum in one chart. The Kumo cloud gives a future projection of potential support and resistance, which is unique compared to traditional static levels.
The system’s use of multiple components offers built-in confirmation, helping traders avoid false signals.
However, for beginners, the five lines and cloud formations can be overwhelming and difficult to interpret. Additionally, Ichimoku, like most trend-following systems, lags behind price action. It is not a leading indicator, which may lead to late entries or exits, especially in fast-moving markets.
Lastly, the sheer number of lines on the chart can lead to visual clutter, making it harder to quickly identify signals without practice.
A Few Practical Tips for Using Ichimoku
Before relying on Ichimoku for live trading, it’s important to practice using the system in a demo account. This will help in developing a deeper understanding of its signals and nuances.
Although Ichimoku is a standalone system, many traders use it in conjunction with other forms of technical analysis, such as candlestick patterns, volume analysis, or other indicators like RSI or MACD, to confirm signals.
For modern markets and different asset classes, adjusting the default settings (9, 26, 52) can help optimize the signals.
You can also check out my other newsletter The Weekly Market Sentiment Report that sends weekly directional views every weekend to highlight the important trading opportunities using a mix between sentiment analysis (COT report, put-call ratio, etc.) and rules-based technical analysis.
If you liked this article, do not hesitate to like and comment, to further the discussion!


