
Trading the Umber Indicator
Presenting and Coding the Umber Indicator


The Umber indicator is the third indicator in the collection of the Chroma indicators after the Carmine and Vanta indicators. This new collection aims to offer a unique glance at financial markets through simple transformation of price and price-derived calculations. The Umber indicator can be considered as a magnet that attracts the price everytime it deviates from it.
Creating the Umber Indicator
Magnet indicators are the bridge between contrarian and regime-detection indicators. They serve to show you how far the current market price is from implied normality. In essence, they tell you than an expected reversal move should happen and gives you the expected target (which is the normality level).
To construct the Umber indicator, follow these steps:
Calculate the maximum of the highs for a 100-period lookback.
Calculate the minimum of the lows for a 100-period lookback.
Calculate the average between the two previous steps.
Calculate a 20-period moving average of the last step’s results.
The code in PineScript is as follows:
// This source code is subject to the terms of the Mozilla Public License 2.0 at https://mozilla.org/MPL/2.0/
// © Sofien-Kaabar

//@version=5
indicator("Chrome Indicators - Umbra", overlay = true)

highest_highs = ta.highest(high, 100)
lowest_lows = ta.lowest(low, 100)
average = (highest_highs + lowest_lows) / 2
umbra = ta.sma(average, 20)

plot(umbra, color = color.rgb(33, 30, 31))
Using the Umber Indicator
Using the Umber indicator is rather simple. The trading conditions are as follows:
A long signal is generated whenever the market price is below the Umber indicator and its distance is relatively big.
A short signal is generated whenever the market price is above the Umber indicator and its distance is relatively big.
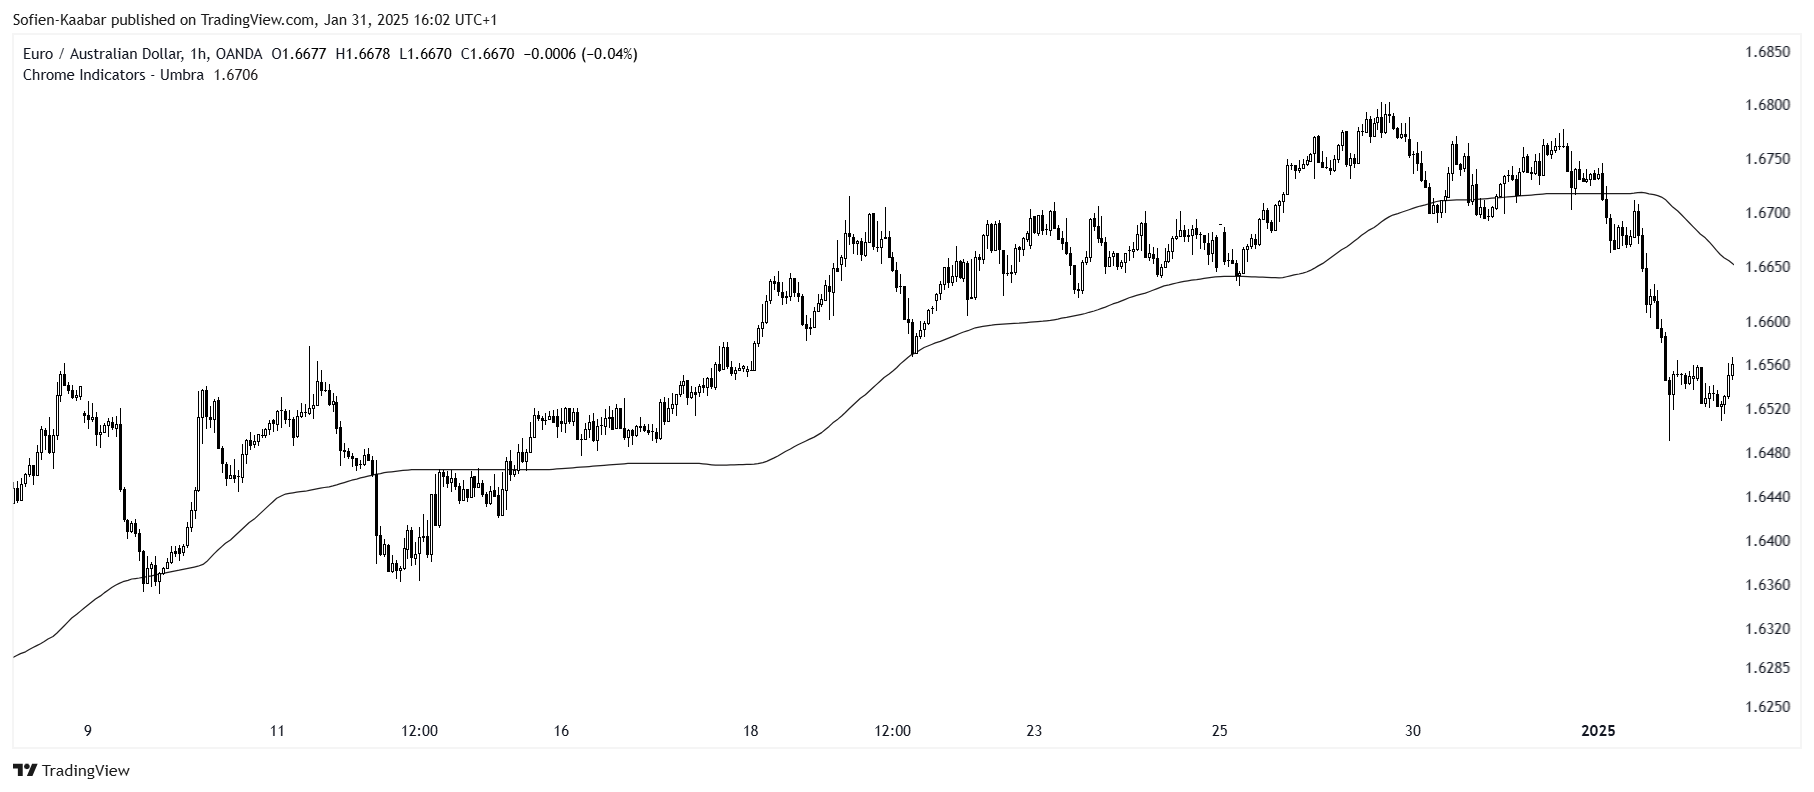
The next Figure shows another example on the Umber indicator.

Make sure to focus on the concepts and not the code. The most important thing is to comprehend the techniques and strategies. The code is a matter of execution but the idea is something you cook in your head for a while.
The Umbra indicator shares the same concept as pivot points. Pivot points are technical analysis indicators used to identify potential support and resistance levels.
Check out my newsletter that sends weekly directional views every weekend to highlight the important trading opportunities using a mix between sentiment analysis (COT report, put-call ratio, etc.) and rules-based technical analysis.
