


The Red indicator is the second indicator in the collection of the colored technical indicators which will be presented in future articles. A contrarian indicator weighted by the market’s trend, the idea is to seek out quick reversal opportunities.
I have released a new book called “Contrarian Trading Strategies in Python”. It features a lot of advanced contrarian indicators and strategies with a GitHub page dedicated to the continuously updated code. If you are interested, you could buy the PDF version directly through a PayPal payment of 9.99 EUR.
Please include your email in the note before paying so that you receive it on the right address. Also, once you receive it, make sure to download it through google drive.
Pay Kaabar using PayPal.Me
If you accept cookies, we’ll use them to improve and customize your experience and enable our partners to show you…www.paypal.com
Creating the Red Indicator
Contrarian indicators are numerous and their predictability varies from market to market and from parameter to parameter. Everyone agrees that performance ratios are not stable and this is to be expected from semi-random markets. The Red indicator is a helping technique that increases the bias for a certain trade. It is not really mean to generate pure signals.
To construct the Red indicator, follow these steps:
Subtract the current close price from the previous close price.
Normalize the differences between close prices between 0 and 100 using a lookback period of 8.
Calculate a 21-period moving average on the normalized values.
Calculate a 100-period moving average on the market price (close price).
If the market price is lower than its moving average while the Red indicator’s value is less than 38.2, then the latter’s value becomes 38.3.
If the market price is greater than its moving average while the Red indicator’s value is greater than 61.8, then the latter’s value becomes 61.7.
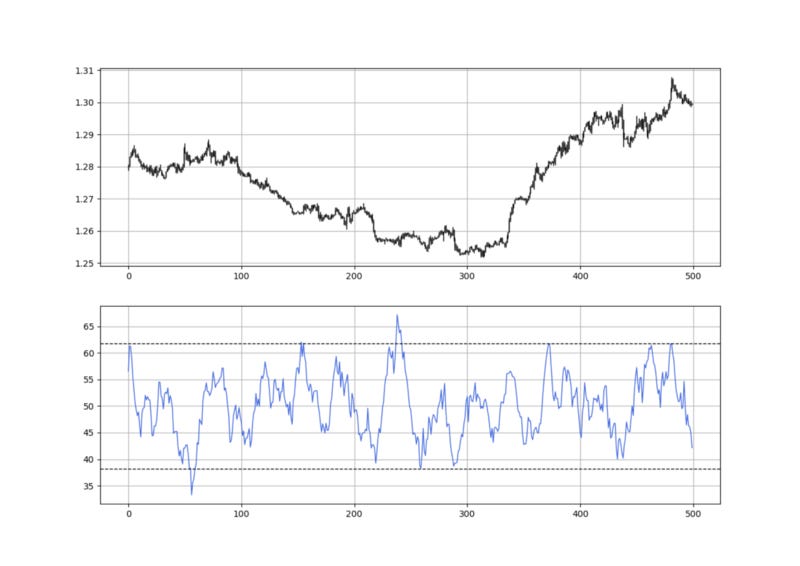
The two last conditions ensure that bullish signals are only given in a bullish trend and bearish signals are only given in a bearish trend. This being said, the Red indicator is a bounded indicator with an upper barrier at 61.8 and a lower barrier at 38.2 (representing Fibonacci ratios as discussed in previous articles).
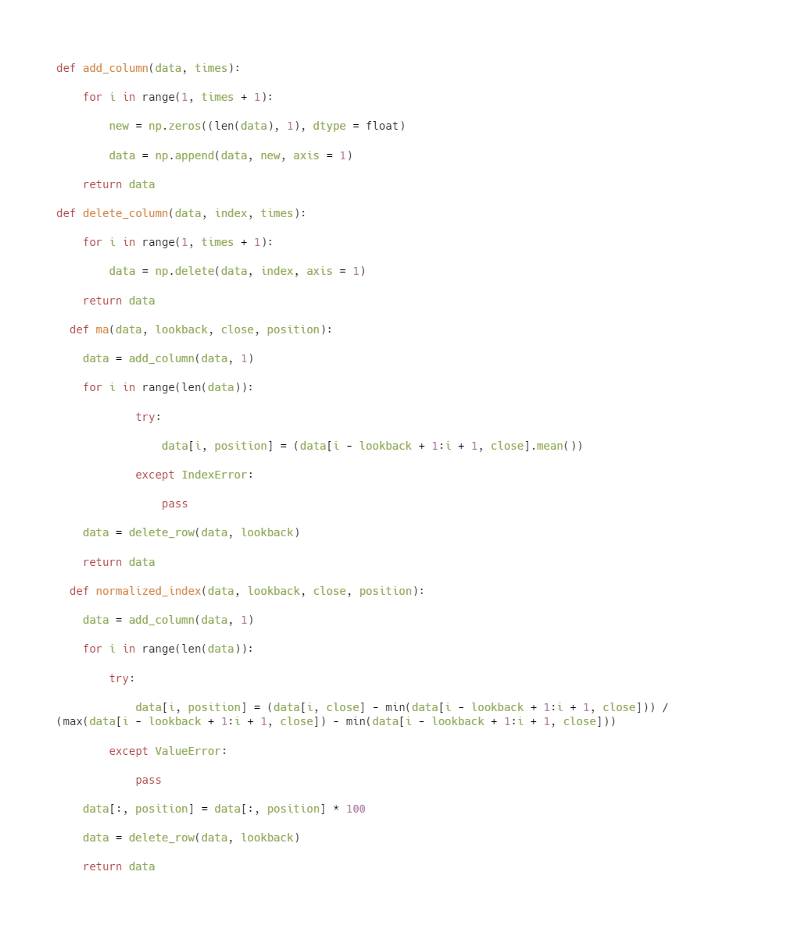
The basic functions you must define are as follows:
The next Figure shows GBPUSD with the Red indicator in the second panel.
The following snippet shows the Red indicator’s function which you apply on an OHLC array (not data frame):

Using the Red Indicator
Using the Red indicator is rather simple as it is bounded between 0 and 100. The idea is that every time it exists these two extremes, a signal is given. The trading conditions are as follows:
A long signal is generated whenever the Red indicator is greater than 38.2 while the previous value is lower than 38.2.
A short signal is generated whenever the Red indicator is lower than 61.8 while the previous value is higher than 61.8.
The following snippet shows the signal function:

The next Figure shows the signal chart on USDCAD’s hourly values. The Red indicator works well in ranging or low-trending markets (as is the case for almost all contrarian indicators). However, with the trend filter, its abilities are improved.

The next Figure shows a signal chart on FTSE100.

Make sure to focus on the concepts and not the code. The most important thing is to comprehend the techniques and strategies. The code is a matter of execution but the idea is something you cook in your head for a while.
Check out my weekly market sentiment report to understand the current positioning and to estimate the future direction of several major markets through complex and simple models working side by side. Find out more about the report through this link:
Coalescence Report 1st May — 8th May 2022
This report covers the weekly market sentiment and positioning and any changes that have occurred which might present…coalescence.substack.com
Summary
To sum up, what I am trying to do is to simply contribute to the world of objective technical analysis which is promoting more transparent techniques and strategies that need to be back-tested before being implemented. This way, technical analysis will get rid of the bad reputation of being subjective and scientifically unfounded.
I recommend you always follow the the below steps whenever you come across a trading technique or strategy:
Have a critical mindset and get rid of any emotions.
Back-test it using real life simulation and conditions.
If you find potential, try optimizing it and running a forward test.
Always include transaction costs and any slippage simulation in your tests.
Always include risk management and position sizing in your tests.
Finally, even after making sure of the above, stay careful and monitor the strategy because market dynamics may shift and make the strategy unprofitable.