Trading The 1.618 Market Pattern
Coding the 1.618 Market Pattern in TradingView


Fibonacci ratios are a huge part of trading. They are found in certain patterns and are used as retracements and projections. This article presents a simple pattern on the RSI which uses a Fibonacci ratio to detect a short-term reversal move using certain conditions.
Presenting the 1.618 Pattern
The 1.618 is a simple pattern composed of four points in time. Similar to the ABCD pattern discussed in previous article, the 1.618 pattern signals a short-term reversal. The difference between the two patterns is that the CD leg is 1.618x the AB leg (as opposed to the ABCD pattern where both legs are equal).
The pattern is applied on the 13-period RSI with bullish signals validated when the pattern appears while the RSI is below 40. In contrast, bearish signals are validated when the pattern appears while the RSI is above 60.
For a detailed and thorough collection of trend following trading strategies, you can check out my book. The book features a huge number of classic and modern techniques as it dwelves into the realm of technical analysis with different trading strategies. The book comes with its own GitHub.
Trend Following Strategies in Python: How to Use Indicators to Follow the Trend
Amazon.com: Trend Following Strategies in Python: How to Use Indicators to Follow the Trend.: 9798756939620: Kaabar…amzn.to
Coding the 1.618 Pattern in TradingView
By applying the 1.618 on the RSI, we get these specified conditions:
For a bullish pattern: Four successive points in time must occur in the shape of a descending ABCD with the CD leg being bigger than the AB leg by a factor between 1.60 and 1.70. At the same time, the last two RSI values must be below 40.
For a bearish pattern: Four successive points in time must occur in the shape of an ascending ABCD with the CD leg being bigger than the AB leg by a factor between 1.60 and 1.70. At the same time, the last two RSI values must be above 60.
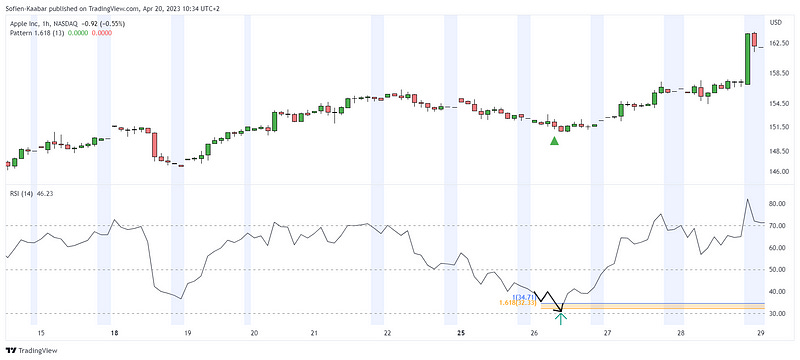
The following Figure shows a signal chart on EURUSD:

The code in Pine Script is as follows:
// This source code is subject to the terms of the Mozilla Public License 2.0 at https://mozilla.org/MPL/2.0/
// © Sofien-Kaabar
//@version=5
indicator("Pattern 1.618", overlay = true)
lookback = input(defval = 13, title = 'Lookback')
rsi = math.round(ta.rsi(close, lookback), 0)
bullish_abcd = rsi < 40 and rsi[1] > rsi and rsi[1] < 40 and rsi[1] > rsi[2] and rsi[2] > rsi and rsi[2] < rsi[3] and (rsi[1] - rsi) > (1.6 * (rsi[3] - rsi[2])) and (rsi[1] - rsi) < (1.7 * (rsi[3] - rsi[2]))
bearish_abcd = rsi > 60 and rsi[1] < rsi and rsi[1] > 60 and rsi[1] < rsi[2] and rsi[2] < rsi and rsi[2] > rsi[3] and (rsi - rsi[1]) > (1.6 * (rsi[2] - rsi[3])) and (rsi - rsi[1]) < (1.7 * (rsi[2] - rsi[3]))
plotshape(bullish_abcd, style = shape.triangleup, color = color.green, location = location.belowbar, size = size.small)
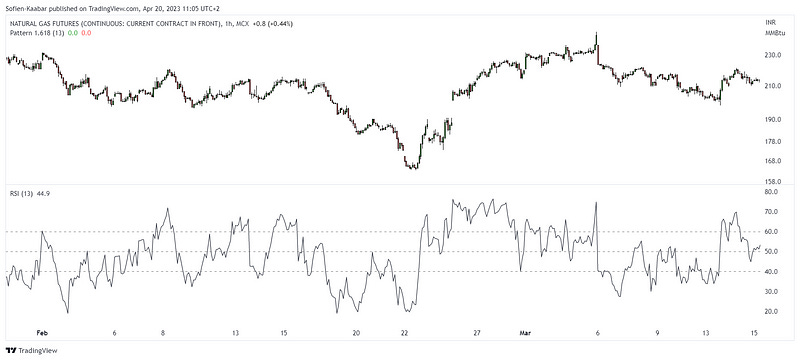
plotshape(bearish_abcd, style = shape.triangledown, color = color.red, location = location.abovebar, size = size.small)The following Figure shows another signal:

The following Figure shows another signal.