Trading One of the Most Powerful Price Action Patterns — The Full Guide.
Presenting and Trading a Powerful Market Price Pattern.
Harmonic Patterns are one of the powerful advanced price action techniques that are used to detect reactions. The thing that works about Harmonic Patterns is that they use the confluence method, meaning that they expect reactions from clusters of certain levels defined by Fibonacci retracements. The reason they work has nothing to do with mystic or magic whatsoever, it is simply the fact that Fibonacci retracements are used by many traders and their visibility makes reactions more likely, thus increasing the predictive power of the patterns. However, only using Harmonic Patterns on their own might not be sufficient as we will see below, they are best combined with contrarian indicators to increase the chances of a profitable trade.
I have just published a new book after the success of my previous one “New Technical Indicators in Python”. It features a more complete description and addition of structured trading strategies with a Github page dedicated to the continuously updated code. If you feel that this interests you, feel free to visit the below link, or if you prefer to buy the PDF version, you could contact me on Linkedin.
The Book of Trading Strategies
Amazon.com: The Book of Trading Strategies: 9798532885707: Kaabar, Sofien: Bookswww.amazon.com
Introduction to the Fibonacci Sequence
Leonardo Bonacci, known as Leonardo Fibonacci has developed a sequence out of rabbit mating which formed the basis for many mathematical observations. The sequence follows this distinct pattern:
The numbers are found by adding the previous two numbers behind them. In the case of 13, it is calculated as 8 + 5, hence the formula is:
The beauty of these numbers is a certain ratio, called the golden ratio. If we take any two successive numbers in the sequence, their ratio (Xn / Xn-1) gets closer to 1.618 which is what we call the golden ratio:
It is not important how we got to trading from these patterns as much as how important they are, therefore, we will discuss the ratios from a financial trading perspective. Let us keep the 1.618 in mind as for the moment it is one of the two most important ratios that we will use in trading. Our job now is to find the rest of the significant ratios useful to us in trading. They are all variations of 1.618 and its reciprocal 0.618. Notice how the reciprocal of 1.618 is simply 0.618. A reciprocal is when you divide 1 by the number. The below table summarizes the rest of the ratios and how we got them:
We will now proceed to define the Pattern and how to detect and trade it.
Building Blocks of the 5–0 Harmonic Pattern
The 5–0 pattern is simply a continuation of the Extreme Harmonic Impulse Wave pattern, hence, to understand it we must thoroughly comprehend the first pattern first, let’s do that.
The Extreme Harmonic Impulse Wave pattern is an interesting configuration that takes advantage of extended moves to detect an imminent reversal level. It is defined as:
The first leg should retrace back either 113.0% or 161.8%.
The second leg should retrace back either 161.8% or 224.0%
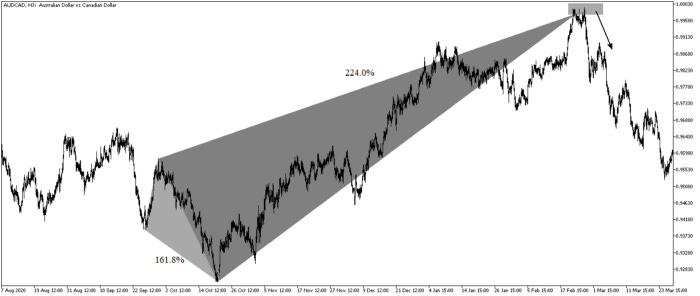
Here is another example of a bearish Extreme Harmonic Impulse Wave that has provided a reaction. Sometimes, harmonic patterns do provide reversals, but we are not supposed to expect that from them. They are merely used for reactions just unlike the one in the below chart.
The figure above shows a nice reaction after prices reached 224.0%. The Extreme Harmonic Impulse Wave pattern benefits from the time factor as extended moves are bound to correct sometime. It is not that easy to detect nor is it common but when it occurs, it definitely adds value to our trading.
The key retracements to watch out for are 161.8% and 224.0% which is simple the sum of the golden ratio and its reciprocal (61.8% + 161.8%). The conviction for the move around the 161.8% is good but better around 224.0% at the cost of missing out if we choose not to initiate the trade around 161.8%.
The Extreme Harmonic Impulse Wave Pattern can start to be detected after the reaction following the initial retracement. Therefore, we have enough time to act on it without any hindsight bias or delay. The below plots show how to detect one across time:
The first step above is detecting the initial wave that should be either 113.0% or 161.8% and then waiting for the reaction to the upside which should trend clearly. In the above plot, we can see two candidates for an initial level, both have retraced back 161.8%.
Now, we can even draw the pattern. All we need is the expected reaction from the C point defined as the 161.8% of the bigger pattern or the 224.0% of the smaller pattern which are coincidentally around the same zone.
The 5–0 Harmonic Pattern
Now that we have understood how to identify the Extreme Harmonic Impulse Wave, it is time to see how to trade the 5–0 which is a simple continuation of the pattern. The idea is that when we reach either 50.0% or 88.6% of the whole pattern’s retracement, the 5–0 pattern appears and signals a reversal or a consolidation.
Take the chart above as an example. When we retrace the whole move from B/B2 to C/C2, the 5–0 pattern requires us to buy whenever we retrace back 50.0%. Sometimes, the market breaks the support and continues going lower. With the 5–0 pattern, this is actually a conviction enhancer for a better level, the next retracement at 88.6%. What this means is that we can either wait for 88.6% to buy with a better conviction or be aggressive and buy at 50.0%.
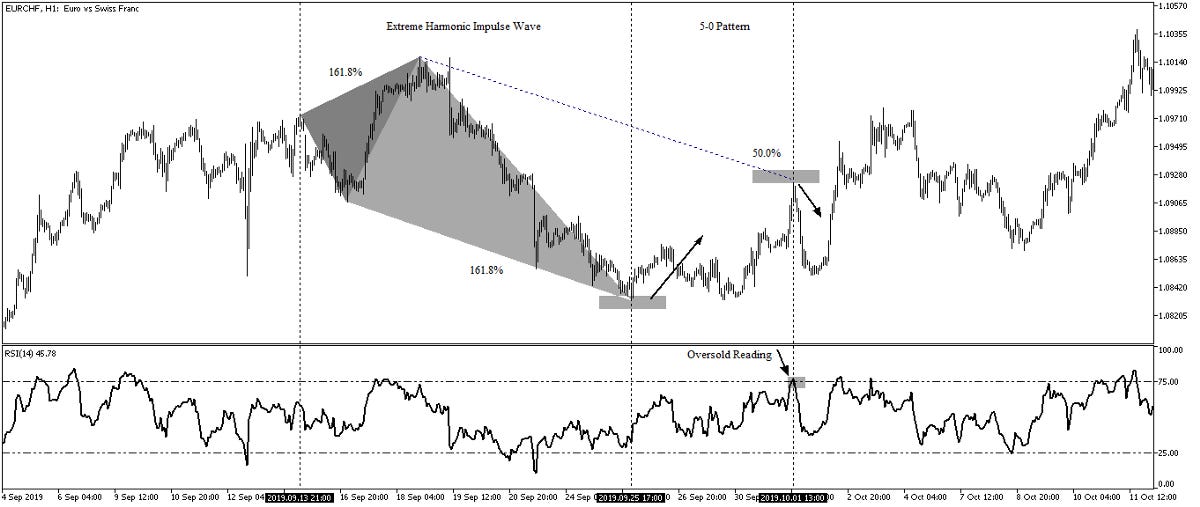
Here is another example showing a bearish 5–0 configuration where we sell short at 50.0% (Aggressive).
And here is yet another example showing a bearish 5–0 configuration where we short sell at 88.6% (Conservative).
How do we know then when to initiate a position? 50.0% or 88.6%? Well, it depends on the below factors:
The readings on the technical indicators. Some indicators such as the RSI help us trade harmonic patterns. When we see that we are close to the 50.0% retracement level and the reading on the RSI is close to the extremes (Either oversold or overbought), we can have more faith that the pattern will work. In case we have
The risk appetite of the trader. We can be either opportunistic traders and try not to miss the trade in case it respects the 50.0% or we can be cautious traders and wait until the conviction is enhanced when the market price reaches the 88.6% retracement level.
If you are also interested by more technical indicators and using Python to create strategies, then my best-selling book on Technical Indicators may interest you:
New Technical Indicators in Python
Amazon.com: New Technical Indicators in Python: 9798711128861: Kaabar, Mr Sofien: Bookswww.amazon.com
Combining the 5–0 Harmonic Pattern with the RSI
Having a 5–0 pattern at its reversal point (pending reaction) and an RSI around extremes or in divergence is a good confirmation of the trade and is a conviction enhancer. But what is the Relative Strength Index?
The RSI is without a doubt the most famous momentum indicator out there, and this is to be expected as it has many strengths especially in ranging markets. It is also bounded between 0 and 100 which makes it easier to interpret. Also, the fact that it is famous, contributes to its potential.
This is because the more traders and portfolio managers look at the RSI, the more people will react based on its signals and this in turn can push market prices. Of course, we cannot prove this idea, but it is intuitive as one of the basis of Technical Analysis is that it is self-fulfilling.
The RSI is calculated using a rather simple way. We first start by taking price differences of one period. This means that we have to subtract every closing price from the one before it. Then, we will calculate the smoothed average of the positive differences and divide it by the smoothed average of the negative differences. The last calculation gives us the Relative Strength which is then used in the RSI formula to be transformed into a measure between 0 and 100.
The above chart shows that around the 50.0% retracement where the pattern is validated at the first level, we also saw an overbought RSI which enhanced our conviction for a reaction to the downside.
Risk Management on the 5–0 Harmonic Pattern
Trading on the patterns requires touching the implied reversal zone, also referred to as Potential Reversal Zone — PRZ. A basic tule of thumb that we can follow when trading is to place two targets with the first one being at 38.2% of the top to bottom (or bottom to top) retracement and the second one being at 61.8%.
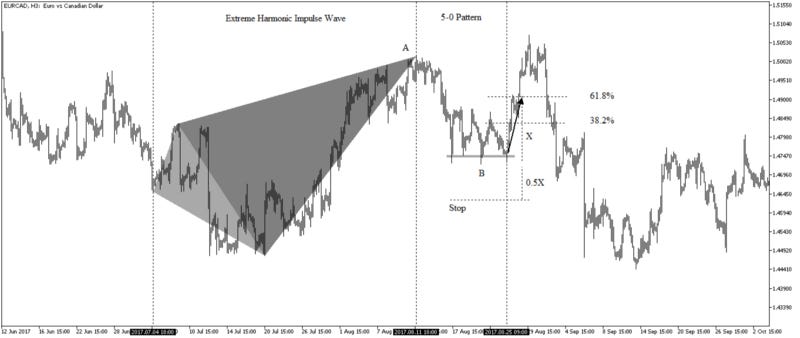
The stop will be placed at half the distance between the entry and the second target thus ensuring a 2.0 risk reward ratio. I generally take half the profits at the first target and move the stop to breakeven, that way I ensure that the trade never loses money in case the price comes back unfavorably. Below is an example on the 5–0 pattern.
We buy at the B point and we target the two level shown in the chart which are retracements of the AB leg. The stop is half the distance between the buying level and the last target, this way we can ensure a good risk-reward ratio.
Conclusion
Remember to always do your back-tests. You should always believe that other people are wrong. My indicators and style of trading may work for me but maybe not for you.
I am a firm believer of not spoon-feeding. I have learnt by doing and not by copying. You should get the idea, the function, the intuition, the conditions of the strategy, and then elaborate (an even better) one yourself so that you back-test and improve it before deciding to take it live or to eliminate it. My choice of not providing specific Back-testing results should lead the reader to explore more herself the strategy and work on it more.
To sum up, are the strategies I provide realistic? Yes, but only by optimizing the environment (robust algorithm, low costs, honest broker, proper risk management, and order management). Are the strategies provided only for the sole use of trading? No, it is to stimulate brainstorming and getting more trading ideas as we are all sick of hearing about an oversold RSI as a reason to go short or a resistance being surpassed as a reason to go long. I am trying to introduce a new field called Objective Technical Analysis where we use hard data to judge our techniques rather than rely on outdated classical methods.


