Trading Extreme Euphoria — Financial Pattern Recognition
Coding the Extreme Euphoria Pattern Scanner in TradingView
Pattern recognition is an exciting field where we extract insights from data that repeats itself and shows on average similar outcomes. The challenge is finding these patterns and validating their potential. This article presents a rare but very powerful pattern I like to call the Extreme Euphoria pattern as it is an extension from a previous pattern I have presented called the Euphoria pattern.
For the complete collection of candlestick patterns in detail with back-tests and technical strategies, you can check out my newest book with O’Reilly Media. The book features a huge number of classic and modern candlestick patterns as it dwelves into the realm of technical analysis with different trading strategies. The book comes with its own GitHub and is dynamic in nature as it is continuously updated and questions are answered on the O’Reilly platform promptly.
Mastering Financial Pattern Recognition
Amazon.com: Mastering Financial Pattern Recognition eBook : Kaabar, Sofien: Kindle Storeamzn.to
The Extreme Euphoria Pattern
Candlestick charts are among the most famous ways to analyze the time series visually. They contain more information than a simple line chart and have more visual interpretability than bar charts.
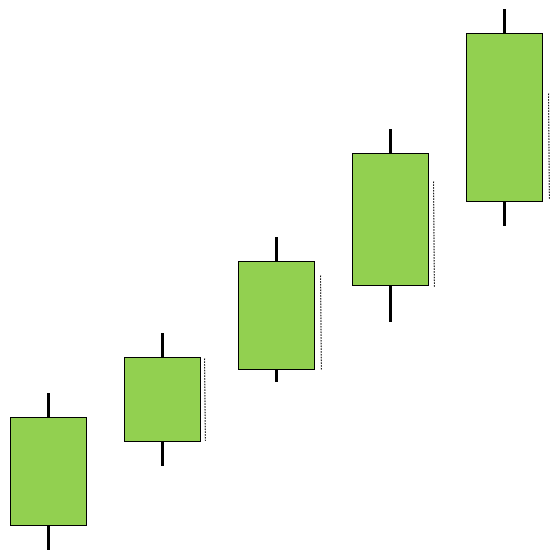
The Extreme Euphoria pattern is the extension of the Euphoria pattern, a configuration discussed in previous articles which is composed three candlesticks. The general shape of the Euphoria pattern is three candlesticks with the same color and have increasing body ranges. Meanwhile, the general shape of the Extreme Euphoria pattern is five candlesticks with the same color and having increasing body ranges with the exception of the second candlestick where it is only preferable to have a bigger body range.
This is because the frequency of signals is greatly reduced if the conditions were strict (even though, theoretically, the conditions are strict but in real life, I have found the hit ratio to be quite acceptable with the flexible condition).
The bullish Extreme Euphoria is composed of five bearish candlesticks with each candlestick having a body range (difference between close and open) bigger than the previous one except for the second one where it is only preferable. The following Figure shows a theoretical illustration of the bullish Extreme Euphoria.
The bearish Extreme Euphoria is composed of five bullish candlesticks with each candlestick having a body range (difference between close and open) bigger than the previous one except for the second one where it is only preferable. The following Figure shows a theoretical illustration of the bearish Extreme Euphoria.
Coding the Scanner in TradingView
The conditions of the pattern are relatively easy to code especially in a straightforward and simple coding language such as Pine Script, TradingView’s native language.
The aim of the scanner is to detect the Extreme Euphoria patterns using the following indications:
A green arrow for bullish Extreme Euphoria signals.
A red arrow for bearish Extreme Euphoria signals.
// This source code is subject to the terms of the Mozilla Public License 2.0 at https://mozilla.org/MPL/2.0/
// © Sofien-Kaabar
//@version=5

indicator("Extreme Euphoria Finder", overlay = true)
bullish_extreme_euphoria  = close[5] < open[5] and close[4] < open[4] and close[3] < open[3] and close[2] < open[2] and close[1] < open[1] and math.abs(close[1] - open[1]) > math.abs(close[2] - open[2]) and math.abs(close[2] - open[2]) > math.abs(close[3] - open[3]) and math.abs(close[3] - open[3]) > math.abs(close[4] - open[4])
bearish_extreme_euphoria  = close[5] > open[5] and close[4] > open[4] and close[3] > open[3] and close[2] > open[2] and close[1] > open[1] and math.abs(close[1] - open[1]) > math.abs(close[2] - open[2]) and math.abs(close[2] - open[2]) > math.abs(close[3] - open[3]) and math.abs(close[3] - open[3]) > math.abs(close[4] - open[4])
plotshape(bullish_extreme_euphoria,  style = shape.triangleup,   color = color.blue,  location =  location.belowbar, size = size.small)
plotshape(bearish_extreme_euphoria,  style = shape.triangledown, color = color.orange,    location =  location.abovebar, size = size.small)
The following Figure shows a signal chart after the code has been applied and executed.


