The Ultimate Reversal Technical Indicator
An All-Star Technical Indicator to Improve Your Trading
Previously, two reversal indicators were presented, K’s Reversal Indicator I and K’s Reversal Indicator III. It is now time to see K’s Reversal Indicator II and wrap the collection.
This indicator is the most powerful one in the collection and is easily integrated into your trading framework. It is composed of a moving average and a timing technique to expect short-term reversals.
The Concept of Moving Averages and Timing Patterns
Moving averages are a fundamental concept in technical analysis, a method used by traders and investors to make decisions about buying or selling financial assets, such as stocks, commodities, or currencies. Moving averages are used to smooth out price data and identify trends over time. They provide valuable insights into an asset’s historical price behavior and can help traders make informed decisions based on past price movements. The most common type of moving averages is the simple moving average.
Timing patterns in financial markets refer to recurring and predictable price patterns or trends that traders and investors use to make decisions about buying or selling assets. These patterns are based on historical price and the belief that similar patterns may repeat in the future. Timing patterns can be identified through technical analysis and can provide valuable insights into potential entry and exit points in the market.
You can also check out my other newsletter The Weekly Market Sentiment Report that sends tactical directional views every weekend to highlight the important trading opportunities using a mix between sentiment analysis (COT reports, Put-Call ratio, Gamma exposure index, etc.) and technical analysis.
K’s Reversal Indicator II
K’s Reversal Indicator II uses a moving average timing technique to deliver its signals. The code will be soon provided on TradingView, so do not burden yourself with the calculation. The method of calculation is as follows:
Calculate a moving average (by default, a 13-period moving average).
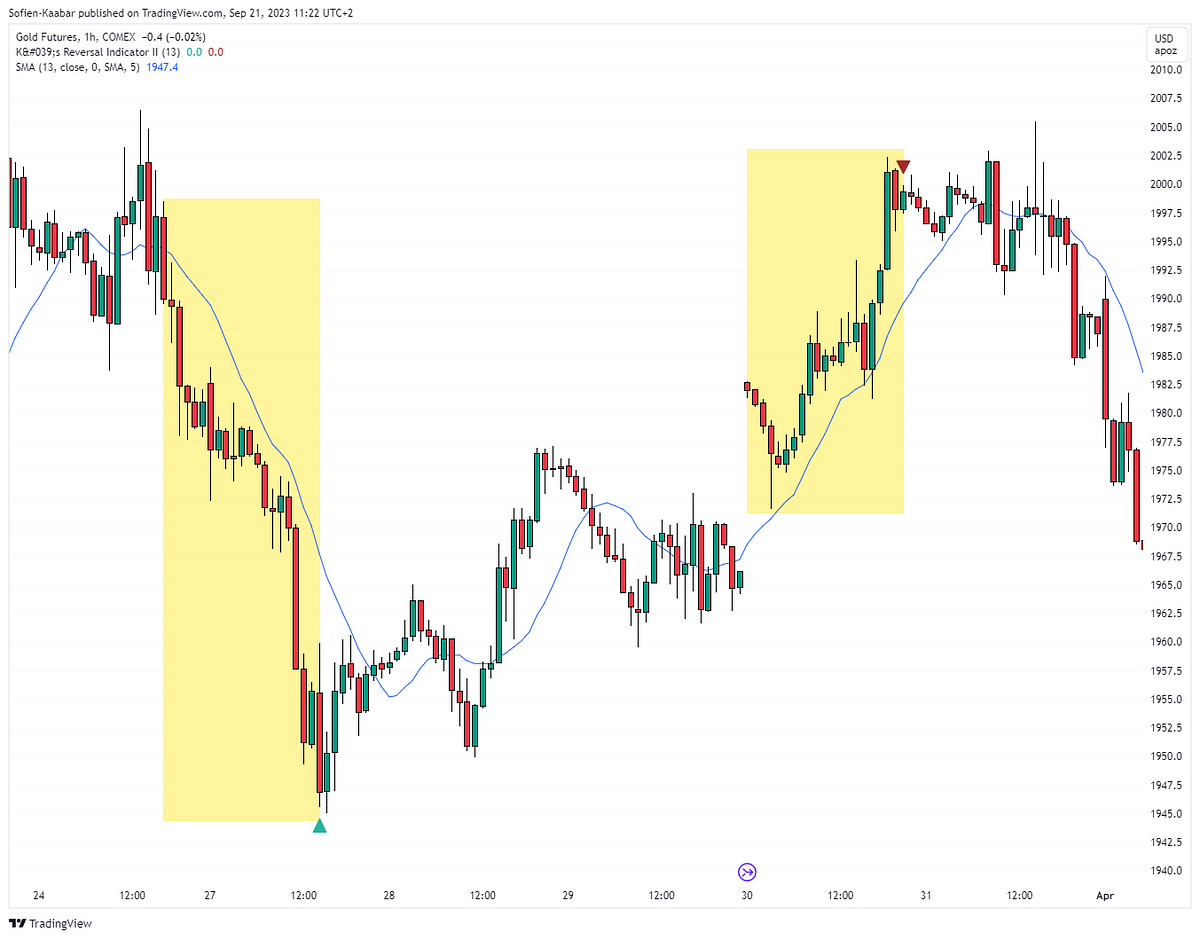
Calculate the number of times where the market is above its moving average. Whenever that number hits 21, a bearish signal is generated, and whenever that number if zero, a bullish signal is generated.
The following chart shows how a bullish signal and a bearish signal are formed.
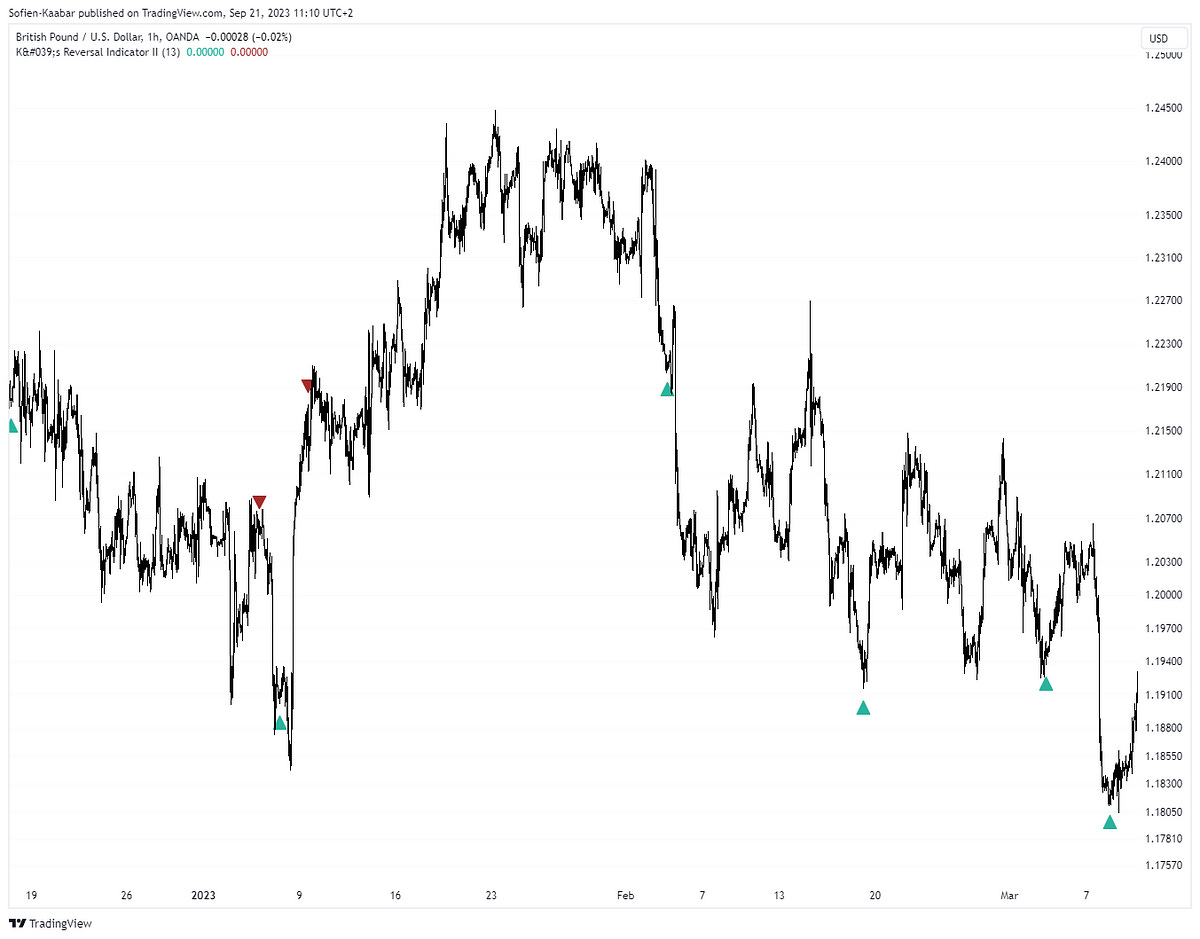
The following chart shows more signals generated from K’s Reversal Indicator II.
On certain trending markets such as the S&P 500, it seems to handle it better than most contrarian indicators, regarding false signals. The following chart shows how the signals in a trending market seem to be of better quality that what is expected.
It is best used during a ranging market as the probability of success will be greater due to the balance between supply and demand.
The code for K’s Reversal Indicator II will be published on TradingView soon.
Wrapping Up The Collection
With this indicator, you have now seen the three reversal indicators from K’s collection.
K’s indicators are a set of personal modern technical indicators composed of either unique calculations or a structural combination of existing indicators. The aim is to enhance market forecasting and signal generation. K’s collection include three distinct indicators called the reversal indicators, which have all previously been discussed in the articles.
K’s Reversal Indicator I: Based on a combination of a MACD oscillator and Bollinger Bands, this indicator uses a special combination to detect reversals.
K’s Reversal Indicator II: Based on the concept of timing and moving average distance, this indicator uses a special combination to detect reversals.
K’s Reversal Indicator III: Based on the concept of autocorrelation and relative momentum, this indicator uses a special combination to detect reversals.
My advice is to use them in tandem with your trading framework.
You can also check out my other newsletter The Weekly Market Analysis Report that sends tactical directional views every weekend to highlight the important trading opportunities using technical analysis that stem from modern indicators. The newsletter is free.
If you liked this article, do not hesitate to like and comment, to further the discussion!


