


The Triple Parabolic Trading Technique
Can We Apply a Triple Parabolic on the Market Price?


This article presents a simple technique to detect the on-going trend using a triple PSAR confirmation tool. It allows you to confirm the current trend and have more convictions in your ideas.
The Parabolic SAR in a Nutshell
The parabolic SAR was introduced by J. Welles Wilder Jr. in 1978, alongside other iconic indicators like the RSI. SAR stands for “Stop and Reverse.” It is primarily designed as a trend-following indicator that also acts as a trailing stop mechanism. Its dual nature makes it a favorite among systematic traders and algorithm designers.
The intuition is simple: in a rising market, price tends to move upwards in a curved, parabolic trajectory. The same is true in reverse for downtrends. Wilder believed that if one could model a price parabola that hugged the trend — tightening as the trend matured — then one could capture the trend's strength while maintaining protective stop levels.
In essence, the parabolic SAR doesn't just aim to follow price; it locks in profits as trends mature, and flips direction when a reversal is statistically likely, hence the “stop and reverse” feature. We’ll break the formula into logical steps, assuming the indicator is being used in an uptrend. The reverse applies symmetrically in a downtrend.
For each time step t, the SAR is calculated as:

Where:
SAR is the current SAR value
α is the acceleration factor (AF), which starts at a base value (usually 0.02) and increases incrementally (e.g., by 0.02) each time a new extreme point is recorded
EP is the extreme point: the highest high of the current uptrend (or lowest low in a downtrend)
The AF is dynamic. It begins at a minimum (e.g., 0.02), and increases by a step (e.g., 0.02) each time a new extreme point (EP) is set. This causes the SAR to accelerate toward price as the trend progresses. However, it’s capped at a maximum value (typically 0.20) to prevent it from getting too tight and prematurely stopping the trend.
The idea is to give the indicator flexibility in early trends, and tightness near maturity, thus locking in profits. The SAR behaves differently depending on whether the market is in an uptrend or downtrend:
In an uptrend, the SAR value rises each period and is plotted below the price.
In a downtrend, it falls each period and is plotted above the price.
Once the SAR value crosses (or is exceeded by) the actual price, the trend flips. This triggers a stop and reverse:
The trend direction reverses.
The SAR “jumps” to the prior EP.
The AF is reset to its base value.
A new EP begins to track in the opposite direction.
This is the heart of the parabolic SAR — not just to indicate trend, but to signal when to exit a position and potentially enter in the opposite direction. To prevent SAR from violating the last two bars’ price action (which would result in false flips), Wilder added bounds:
In an uptrend, the SAR for the next period cannot be greater than the lowest price of the previous two bars.
In a downtrend, the SAR for the next period cannot be less than the highest price of the previous two bars.
This safeguard ensures that the SAR respects recent price structure and doesn’t prematurely flip due to sudden price spikes. Let’s simulate what happens in a real uptrend:
SAR starts just below the price.
Each new high pushes the EP higher, incrementing the AF.
SAR creeps up toward price faster and faster.
Eventually, the price dips below the rising SAR — triggering a reversal.
SAR flips to above price, EP becomes the recent low, AF resets.
The new SAR starts dropping — now on the short side.
This back-and-forth makes the SAR ideal for systematic trading systems — it gives a trend direction, a trailing stop, and a clear reversal entry point.

Do you want to master Deep Learning techniques tailored for time series, trading, and market analysis🔥? My book breaks it all down from basic machine learning to complex multi-period LSTM forecasting while going through concepts such as fractional differentiation and forecasting thresholds. Get your copy here 📖!
The Triple Parabolic Technique
This technique applies three different types of PSAR on the market price, then uses a simple condition to find the current trend:
Calculate a PSAR(0.005, 0.005, 0.05).
Calculate a PSAR(0.02, 0.02, 0.2).
Calculate a PSAR(0.32, 0.32, 0.64).
A bullish confirmation is generated whenever the market is above all PSARs.
A bearish confirmation is generated whenever the market is below all PSARs.
This technique only confirms the on-going trend, and does not really generate trading signals. Use the following Pine Script code to visualize it.
// This Pine Script® code is subject to the terms of the Mozilla Public License 2.0 at https://mozilla.org/MPL/2.0/
// © Sofien-Kaabar

//@version=6
indicator("My script", overlay = true)

psar1 = ta.sar(0.005, 0.005, 0.05)
psar2 = ta.sar(0.02, 0.02, 0.2)
psar3 = ta.sar(0.32, 0.32, 0.64)

buy  = close > psar1 and close > psar2 and close > psar3
sell = close < psar1 and close < psar2 and close > psar3

plotshape(buy,  style = shape.triangleup, color = color.green, location =  location.belowbar, size = size.small)
plotshape(sell,  style = shape.triangledown, color = color.red, location =  location.abovebar, size = size.small)
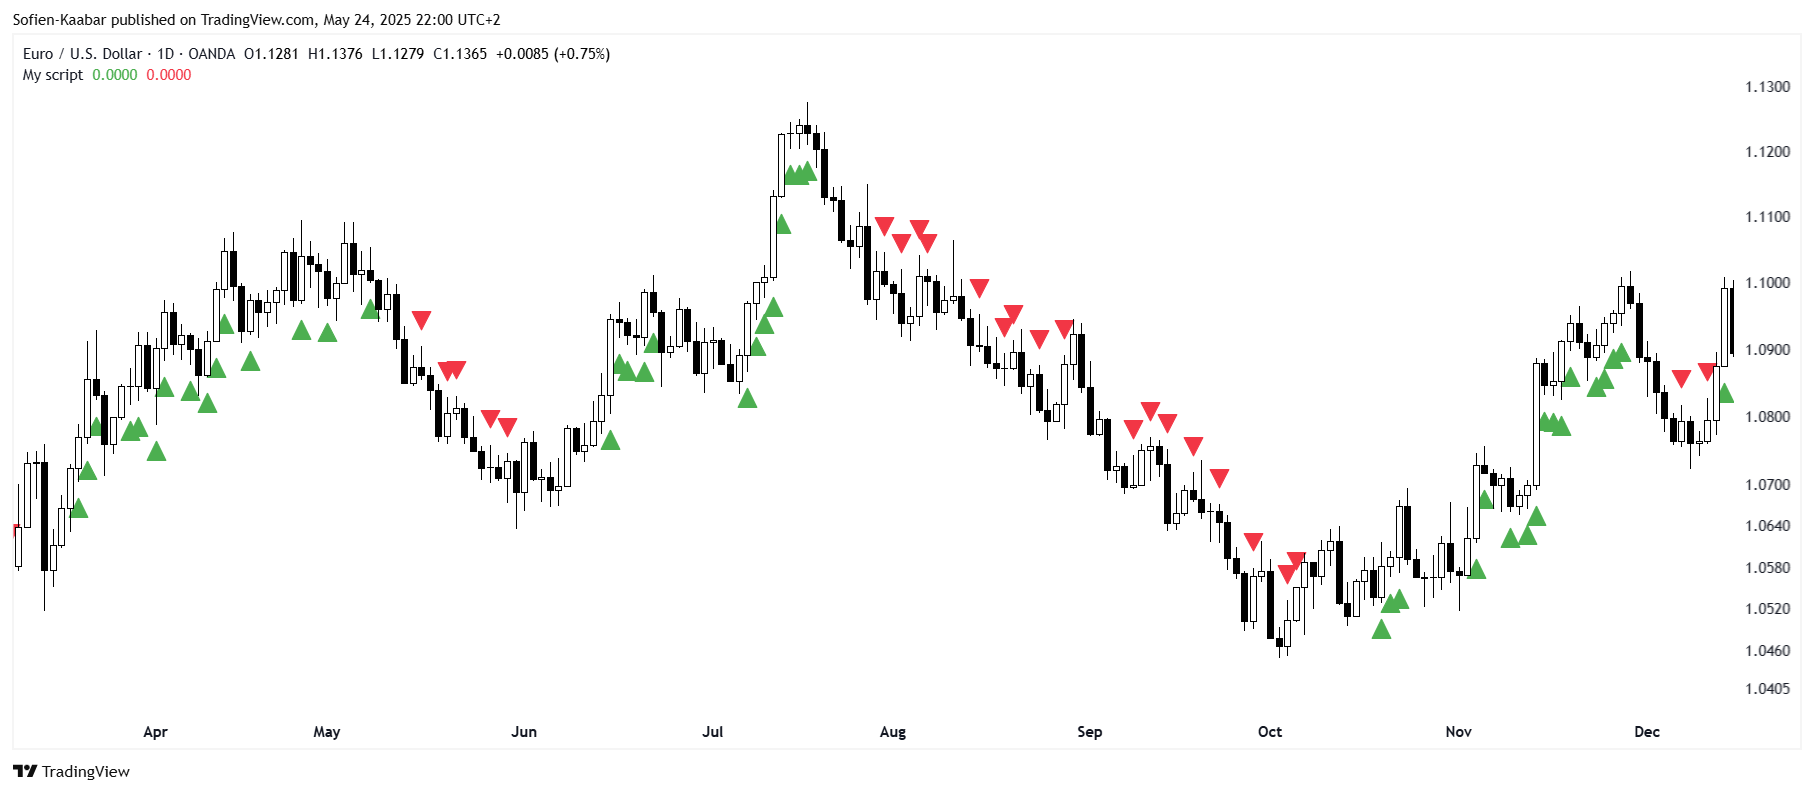
The above chart shows that whenever there is a cluster of green triangles, a bullish trend is going on and is healthy. Meanwhile, red arrows designate a bearish trend.

It’s best to combine this technique with other trend following tools to make sure you don’t fall into a false breakout trap. When there is a switch from green to red or vice versa, it does not necessarily mean a trend reversal will occur, but simply a weakening in the on-going trend and a possible profit-taking timing.
Every week, I analyze positioning, sentiment, and market structure. Curious what hedge funds, retail, and smart money are doing each week? Then join hundreds of readers here in the Weekly Market Sentiment Report 📜 and stay ahead of the game through chart forecasts, sentiment analysis, volatility diagnosis, and seasonality charts.
Free trial available🆓
