
The Triangular Moving Average
Coding & Presenting the Triangular Moving Average

Moving averages come in all shapes and forms and each type has its advantages and limitations. In this article, we will discuss a less common type called the triangular moving average.
For a detailed and thorough collection of contrarian trading strategies, you can check out my book. The book features a huge number of classic and modern techniques as it dwelves into the realm of technical analysis with different trading strategies. The book comes with its own GitHub.
Contrarian Trading Strategies in Python
Amazon.com: Contrarian Trading Strategies in Python: 9798434008075: Kaabar, Sofien: Booksamzn.to
The Concept of Moving Averages
Moving averages help us confirm and ride the trend. They are the most known technical indicator and this is because of their simplicity and their proven track record of adding value to the analyses. We can use them to find support and resistance levels, stops and targets, and to understand the underlying trend. This versatility makes them an indispensable tool in our trading arsenal.

As the name suggests, this is your plain simple mean that is used everywhere in statistics and basically any other part in our lives. It is simply the total values of the observations divided by the number of observations. Mathematically speaking, it can be written down as:

We can see that the moving average is providing decent dynamic support and resistance levels from where we can place our orders in case the market goes down there. The code for the moving average can be written down as the following:
# The function to add a number of columns inside an array
def adder(Data, times):

    for i in range(1, times + 1):

        new_col = np.zeros((len(Data), 1), dtype = float)
        Data = np.append(Data, new_col, axis = 1)

    return Data
# The function to delete a number of columns starting from an index
def deleter(Data, index, times):
for i in range(1, times + 1):
Data = np.delete(Data, index, axis = 1)
return Data
# The function to delete a number of rows from the beginning
def jump(Data, jump):
Data = Data[jump:, ]
return Data
# Example of adding 3 empty columns to an array
my_ohlc_array = adder(my_ohlc_array, 3)
# Example of deleting the 2 columns after the column indexed at 3
my_ohlc_array = deleter(my_ohlc_array, 3, 2)
# Example of deleting the first 20 rows
my_ohlc_array = jump(my_ohlc_array, 20)
# Remember, OHLC is an abbreviation of Open, High, Low, and Close and it refers to the standard historical data fileThe below states that the moving average function will be called on the array named my_data for a lookback period of 200, on the column indexed at 3 (closing prices in an OHLC array). The moving average values will then be put in the column indexed at 4 which is the one we have added using the adder function.
my_data = ma(my_data, 200, 3, 4)Creating the Triangular Moving Average
This is a simple moving average applied to a simple moving average applied on the market price. Therefore, we are just using the function twice but on different time series.
# Indicator Parameters
lookback = 60
my_data = ma(my_data, lookback, 3, 4)
my_data = ma(my_data, lookback, 4, 5)
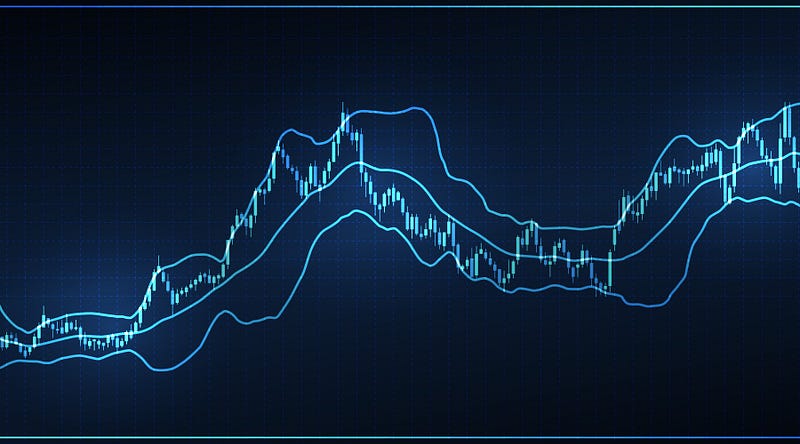
The above chart shows the EURGBP hourly values with the triangular moving average which seems to be more lagging but capturing good reactions. The strategies used by this type of moving average are exactly the same as the common ones such as crossovers and dynamic support/resistance levels.

If you want to see how to create all sorts of algorithms yourself, feel free to check out Lumiwealth. From algorithmic trading to blockchain and machine learning, they have hands-on detailed courses that I highly recommend.
Learn Algorithmic Trading with Python Lumiwealth
Learn how to create your own trading algorithms for stocks, options, crypto and more from the experts at Lumiwealth. Click to learn more
Summary
To sum up, what I am trying to do is to simply contribute to the world of objective technical analysis which is promoting more transparent techniques and strategies that need to be back-tested before being implemented. This way, technical analysis will get rid of the bad reputation of being subjective and scientifically unfounded.
I recommend you always follow the the below steps whenever you come across a trading technique or strategy:
Have a critical mindset and get rid of any emotions.
Back-test it using real life simulation and conditions.
If you find potential, try optimizing it and running a forward test.
Always include transaction costs and any slippage simulation in your tests.
Always include risk management and position sizing in your tests.
Finally, even after making sure of the above, stay careful and monitor the strategy because market dynamics may shift and make the strategy unprofitable.