
The Triangular Moving Average.
Coding & Presenting the Linear-Weighted Moving Average.


Moving averages come in all shapes and forms and each type has its advantages and limitations. In this article, we will discuss a less common type called the triangular moving average.
I have just published a new book after the success of my previous one “New Technical Indicators in Python”. It features a more complete description and addition of structured trading strategies with a GitHub page dedicated to the continuously updated code. If you feel that this interests you, feel free to visit the below Amazon link, or if you prefer to buy the PDF version, you could contact me on LinkedIn.
The Concept of Moving Averages
Moving averages help us confirm and ride the trend. They are the most known technical indicator and this is because of their simplicity and their proven track record of adding value to the analyses. We can use them to find support and resistance levels, stops and targets, and to understand the underlying trend. This versatility makes them an indispensable tool in our trading arsenal.

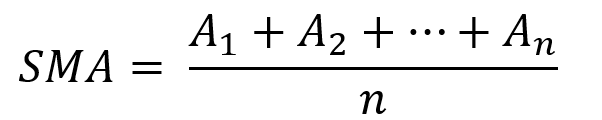
As the name suggests, this is your plain simple mean that is used everywhere in statistics and basically any other part in our lives. It is simply the total values of the observations divided by the number of observations. Mathematically speaking, it can be written down as:
We can see that the moving average is providing decent dynamic support and resistance levels from where we can place our orders in case the market goes down there. The code for the moving average can be written down as the following:
# The function to add a number of columns inside an array
def adder(Data, times):

    for i in range(1, times + 1):

        new_col = np.zeros((len(Data), 1), dtype = float)
        Data = np.append(Data, new_col, axis = 1)

    return Data
# The function to delete a number of columns starting from an index
def deleter(Data, index, times):
for i in range(1, times + 1):
Data = np.delete(Data, index, axis = 1)
return Data
# The function to delete a number of rows from the beginning
def jump(Data, jump):
Data = Data[jump:, ]
return Data# Example of adding 3 empty columns to an array
my_ohlc_array = adder(my_ohlc_array, 3)# Example of deleting the 2 columns after the column indexed at 3
my_ohlc_array = deleter(my_ohlc_array, 3, 2)# Example of deleting the first 20 rows
my_ohlc_array = jump(my_ohlc_array, 20)# Remember, OHLC is an abbreviation of Open, High, Low, and Close and it refers to the standard historical data fileThe below states that the moving average function will be called on the array named my_data for a lookback period of 200, on the column indexed at 3 (closing prices in an OHLC array). The moving average values will then be put in the column indexed at 4 which is the one we have added using the adder function.
my_data = ma(my_data, 200, 3, 4)Creating the Triangular Moving Average
This is a simple moving average applied to a simple moving average applied on the market price. Therefore, we are just using the function twice but on different time series.
# Indicator Parameters
lookback = 60
my_data = ma(my_data, lookback, 3, 4)
my_data = ma(my_data, lookback, 4, 5)
The above chart shows the EURGBP hourly values with the triangular moving average which seems to be more lagging but capturing good reactions. The strategies used by this type of moving average are exactly the same as the common ones such as crossovers and dynamic support/resistance levels.

Conclusion
Remember to always do your back-tests. You should always believe that other people are wrong. My indicators and style of trading may work for me but maybe not for you.
I am a firm believer of not spoon-feeding. I have learnt by doing and not by copying. You should get the idea, the function, the intuition, the conditions of the strategy, and then elaborate (an even better) one yourself so that you back-test and improve it before deciding to take it live or to eliminate it. My choice of not providing specific Back-testing results should lead the reader to explore more herself the strategy and work on it more.
To sum up, are the strategies I provide realistic? Yes, but only by optimizing the environment (robust algorithm, low costs, honest broker, proper risk management, and order management). Are the strategies provided only for the sole use of trading? No, it is to stimulate brainstorming and getting more trading ideas as we are all sick of hearing about an oversold RSI as a reason to go short or a resistance being surpassed as a reason to go long. I am trying to introduce a new field called Objective Technical Analysis where we use hard data to judge our techniques rather than rely on outdated classical methods.