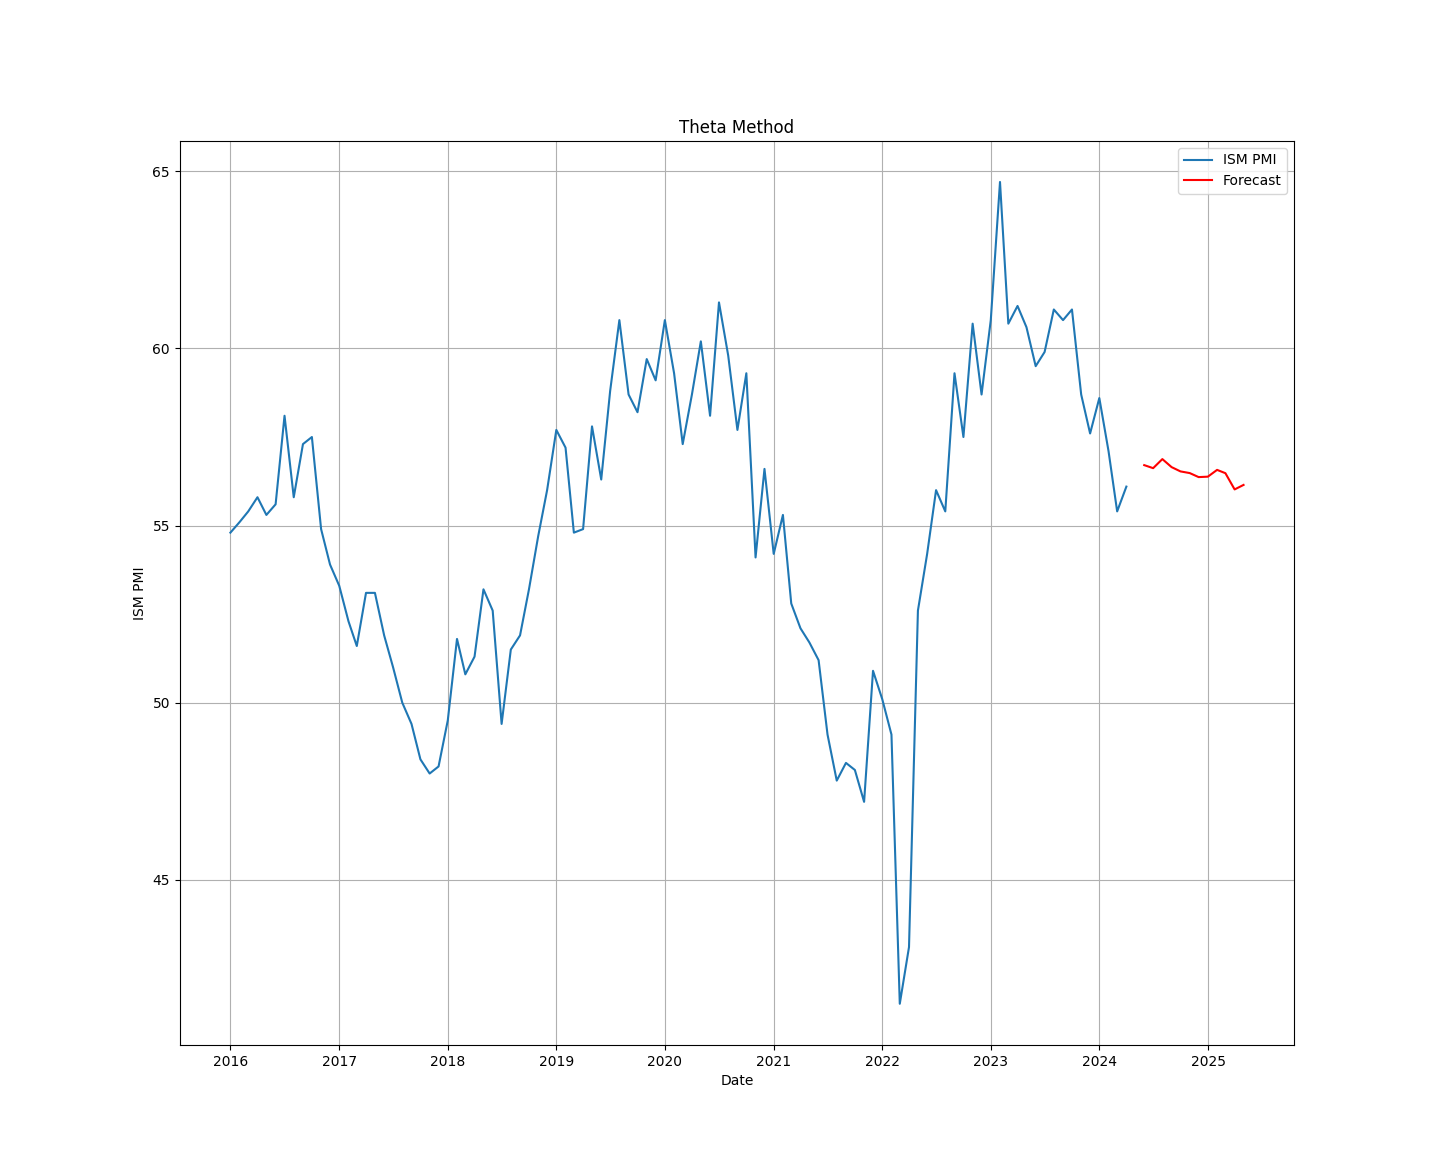
One method for predicting future values of a time series is the Theta method. It integrates two fundamental concepts: breaking down the time series and utilizing basic forecasting techniques to estimate future values.
This article sheds some light about its intuition and shows how to create an algorithm in Python based on the Theta method.
What is the Theta Method?
As every data science enthusiast knows, a time series is a sequence of data points collected or recorded at regular time intervals. For example, daily temperatures or the monthly values of an economic indicator.
Think of a time series as a combination of different components, trend (the general direction in which the data is moving), seasonality (regular patterns that repeat over time), and noise (random fluctuations that cannot be attributed to trend or seasonality).
The Theta method modifies the time series to highlight different components. This is done by adding or subtracting a trend component to/from the original series. For example, if we choose a Theta value of 2, we create a new series where the influence of the trend is doubled. If Theta is 0, it removes the trend entirely, focusing only on the cyclical and irregular components.
After the series is processed, it is subjected to basic forecasting techniques such exponential smoothing, which highlights longer-term patterns by smoothing out short-term volatility. Because the transformation has highlighted the patterns in the data, these straightforward techniques work well.
Creating a Theta Method Algorithm For Time Series Analysis in Python
In layman’s terms, imagine you are trying to predict the future sales of a store. You notice that sales have been generally increasing over the years (trend), but also that there’s a spike in sales every December (seasonality). On top of that, there are random fluctuations in sales due to various unpredictable factors (noise).
The Theta method helps you separate these different influences, making it easier to understand the underlying patterns. By focusing on and forecasting each component separately, and then combining these forecasts, you get a more reliable prediction of future sales.
Let’s create a really simple algorithm in Python that uses the Theta method to predict the future values of the ISM PMI.
The ISM PMI refers to the Institute for Supply Management (ISM) Purchasing Managers’ Index (PMI). It is a widely-watched economic indicator in the United States, providing insight into the overall health of the manufacturing and service sectors.
A PMI reading above 50 indicates that the manufacturing or service sector is expanding, while a reading below 50 signifies contraction.
First, download the historical data of the ISM PMI here (GitHub link). Next, use the following code to generate the algorithm:
import numpy as np
import pandas as pd
import matplotlib.pyplot as plt
from statsmodels.tsa.holtwinters import ExponentialSmoothing

def theta_decomposition(time_series, theta):
    trend = np.polyval(np.polyfit(np.arange(len(time_series)), time_series, 1), np.arange(len(time_series)))
    deseasonalized = time_series - trend
    theta_series = deseasonalized + (theta * trend)
    return theta_series, trend
def forecast_theta(time_series, theta, forecast_horizon):
    # Decompose the time series
    theta_series, trend = theta_decomposition(time_series, theta)

    # Fit an Exponential Smoothing model on the theta series
    model = ExponentialSmoothing(theta_series, seasonal='add', seasonal_periods=12).fit()

    # Forecast the future values
    forecast_values = model.forecast(forecast_horizon)

    # Add the trend component back to the forecasted values
    trend_forecast = np.polyval(np.polyfit(np.arange(len(time_series)), time_series, 1),
                                np.arange(len(time_series), len(time_series) + forecast_horizon))
    final_forecast = forecast_values + trend_forecast

    return final_forecast
if __name__ == "__main__":
    time_series = pd.read_excel('ISM_PMI.xlsx')
    time_series['Date'] = pd.to_datetime(time_series['Date'])
    time_series.set_index('Date', inplace=True)
    time_series = time_series['Value']

    # Set theta and forecast horizon
    theta = 0
    forecast_horizon = 12

    # Forecast future values
    forecast_values = forecast_theta(time_series, theta, forecast_horizon)

    # Plot the original series and the forecast
    plt.figure(figsize=(10, 6))
    plt.plot(time_series[-100:,], label='ISM PMI')
    plt.plot(pd.date_range(start=time_series.index[-1], periods=forecast_horizon+1, freq='M')[1:], forecast_values, label='Forecast', color='red')
    plt.title('Theta Method')
    plt.xlabel('Date')
    plt.ylabel('ISM PMI')
    plt.legend()
    plt.grid()
    plt.show()
Note that we have chosen to use the exponential smoothing algorithm in the Theta method.
The following shows the next 12 months’ predictions of the ISM PMI using the Theta method. A bit too simple as an algorithm, but it’s a start.
The Theta method is a powerful yet simple approach to forecasting time series. It involves transforming the series to highlight different components, applying simple forecasting techniques, and then combining the results for a final forecast.
This method is particularly effective because it makes the inherent patterns in the data more obvious, leading to more accurate predictions.
It has its limitations of course as any other machine learning algorithm, but knowing the weaknesses leads to mastering the strengths.
You can also check out my other newsletter The Weekly Market Sentiment Report that sends weekly directional views every weekend to highlight the important trading opportunities using a mix between sentiment analysis (COT report, put-call ratio, etc.) and rules-based technical analysis.
If you liked this article, do not hesitate to like and comment, to further the discussion!


