The Super Stochastic Trading Strategy
Creating & Evaluating the Super Stochastic Exit Strategy
Without a doubt the stochastic oscillator is a universally used indicator. It uses such a simple yet powerful formula in order to detect rapid oversold and overbought conditions. This article discusses a certain strategy based on this indicator.
The Stochastic Oscillator
The Stochastic Oscillator is a technical indicator widely used in financial analysis, especially in the field of technical analysis for trading stocks, forex, and other financial instruments. It helps traders and analysts identify potential overbought and oversold conditions in a market, which can assist in making decisions about buying or selling assets.
The Stochastic Oscillator consists of two lines, typically referred to as %K and %D:
%K Line: This is the main line of the oscillator and represents the current closing price relative to the trading range over a specified period. The formula for calculating %K is:
%K = (Current Close — Lowest Low) / (Highest High — Lowest Low) * 100
Here, the “Current Close” is the most recent closing price, “Lowest Low” is the lowest price over the specified period, and “Highest High” is the highest price over the same period.
%D Line: This is a smoothed version of the %K line and is often represented as a moving average of the %K values. The purpose of %D is to reduce the noise and provide a smoother representation of the oscillator’s movement.
The Stochastic Oscillator generates values between 0 and 100. It’s commonly plotted as two lines on a chart, with 80 and 20 typically used as threshold levels. When the %K line crosses above the %D line and both are below the 20 level, it may indicate a potential buying opportunity, as the asset might be oversold. Conversely, when the %K line crosses below the %D line and both are above the 80 level, it may suggest a potential selling opportunity, as the asset might be overbought.
Traders often use the Stochastic Oscillator in conjunction with other technical indicators and chart patterns to confirm potential trading signals. Like all technical indicators, it’s important to understand that the Stochastic Oscillator is not foolproof and should be used alongside other forms of analysis and risk management strategies.
Do you want to master Deep Learning techniques tailored for time series, trading, and market analysis? My book breaks it all down from basic Machine Learning to complex multi-period LSTM forecasting while going through concepts such as Fractional Differentiation and forecasting thresholds. Get your copy here!
Creating & Evaluating the Strategy
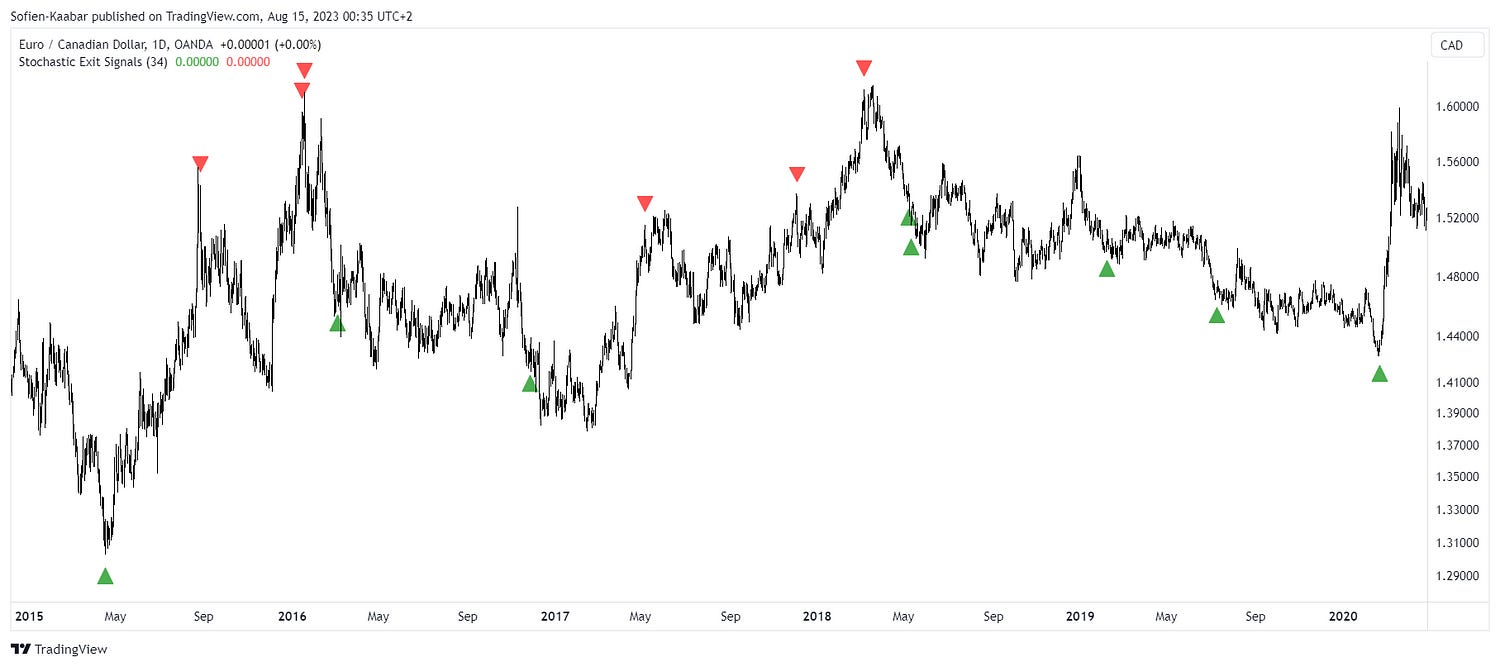
The strategy is pretty clear, we will initiate position based on the exit of extremes. Therefore, the trading conditions are:
A buy (long) signal is generated whenever the current 34-period stochastic oscillator (smoothed with a 5-period moving average) is above 5 and below 30 while the previous reading is below 5.
A sell (short) signal is generated whenever the current 34-period stochastic oscillator (smoothed with a 5-period moving average) is below 95 and above 70 while the previous reading is above 95.
The following Figure shows a few signals from the technique:
// This source code is subject to the terms of the Mozilla Public License 2.0 at https://mozilla.org/MPL/2.0/
// © Sofien-Kaabar

//@version=5
indicator("Stochastic Exit Signals", overlay = true)
lookback = input(defval = 34, title = 'Lookback')
stoch = ta.sma(ta.stoch(close, high, low, lookback), 5)
buy_signal = stoch > 5 and stoch[1] < 5 and stoch < 30
sell_signal = stoch < 95 and stoch[1] > 95 and stoch > 70
plotshape(buy_signal,  style = shape.triangleup,   color = color.green,  location =  location.belowbar, size = size.small)
plotshape(sell_signal,  style = shape.triangledown, color = color.red,    location =  location.abovebar, size = size.small)
The following Figure shows more signals from the technique:
The following Figure shows more signals from the technique:
Every week, I analyze positioning, sentiment, and market structure. Curious what hedge funds, retail, and smart money are doing each week? Then join hundreds of readers here in the Weekly Market Sentiment Report and stay ahead of the game through chart forecasts, sentiment analysis, and volatility diagnosis.
Free trial available.


