The Stochastic Keltner Trading Strategy — A Back-test
Creating and Back-testing a Contrarian Trading Strategy in Trading View
This article discusses a trading strategy based on the stochastic oscillator and the Keltner channel, a known volatility indicator. The strategy’s type is contrarian and is best used in ranging markets. The second part of the article will deal with performance evaluation on a selected sample of markets.
The Stochastic Oscillator
The stochastic oscillator is a known bounded technical indicator based on the normalization function. It traps the high, low, and close prices between 0 and 100 so as we get a glance on overstretched markets.
The stochastic oscillator (raw version) is calculated as follows:
Subtract the current close from the lowest low during the last 14 periods. Let’s call this step one.
Subtract the highest high during the last 14 periods from he lowest low during the last 14 periods. Let’s call this step two.
Divide step one by step two and multiply by 100.
The result is the raw version of the stochastic oscillator. The following Figure shows an example of the 14-period stochastic oscillator.
You can also check out my other newsletter The Weekly Market Sentiment Report that sends tactical directional views every weekend to highlight the important trading opportunities using a mix between sentiment analysis (COT reports, Put-Call ratio, Gamma exposure index, etc.) and technical analysis.
The Keltner Channel
The Keltner channel is a volatility bands indicator which tries to envelop the market price so as to find dynamic support and resistance levels. The steps used to calculate the Keltner channel are as follows:
Calculate an exponential moving average on the close prices.
Calculate an average true range (ATR) using the specified lookback period.
Add step one to step two and multiply by a constant.
Subtract step one from step two and multiply by a constant.
The following Figure shows an example of the 20-period Keltner channel.
Creating the Strategy
The strategy is simple and has the following conditions:
A bullish signal is generated whenever the 34-period stochastic oscillator is lower than 10 while the market has just surpassed the lower Keltner.
A bearish signal is generated whenever the 34-period stochastic oscillator is above 90 while the market has just broken to the downside the upper Keltner.
// This Pine Script™ code is subject to the terms of the Mozilla Public License 2.0 at https://mozilla.org/MPL/2.0/
// © Sofien-Kaabar

//@version=5
strategy("My strategy", overlay=true, margin_long=100, margin_short=100)

stochastic = ta.stoch(close, high, low, 34)

lower_keltner = ta.ema(close, 20) - (ta.atr(20) * 2)
upper_keltner = ta.ema(close, 20) + (ta.atr(20) * 2)

longCondition = stochastic < 10 and close > lower_keltner and close[1] < lower_keltner[1]
if (longCondition)
    strategy.entry("My Long Entry Id", strategy.long)

shortCondition = stochastic > 90 and close < upper_keltner and close[1] > upper_keltner[1]
if (shortCondition)
    strategy.entry("My Short Entry Id", strategy.short)
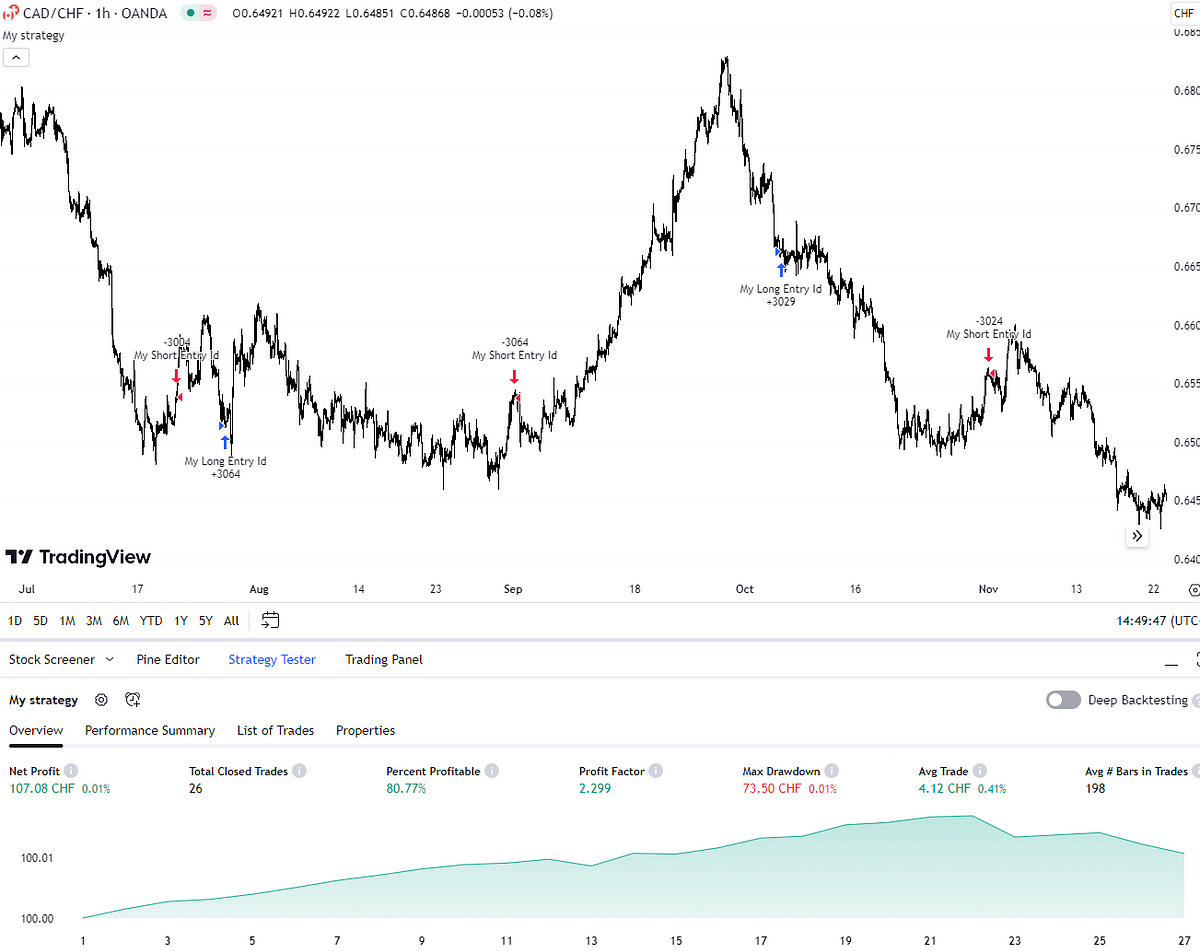
The following Figure shows an example of a signal chart.
The following Figure shows an example of a signal chart.
Performance Evaluation
If we perform a simple back-test to assess the predictive power of the strategy on CADCHF and AUDUSD, we will find the following results:
More research is needed into how to optimize the strategy. For now, make sure to back-test it with more data so that you understand the problem of back-tests.
You can also check out my other newsletter The Weekly Market Analysis Report that sends tactical directional views every weekend to highlight the important trading opportunities using technical analysis that stem from modern indicators. The newsletter is free.
If you liked this article, do not hesitate to like and comment, to further the discussion!


