The Rise of The Heikin-Ashi RSI in Trading Strategies
Unleashing the Power of the Heikin-Ashi RSI for Dynamic Market Movements
This article presents a new idea on combining Heikin-Ashi techniques with the well-known RSI.
The Main Components of the Indicator
The RSI is a momentum oscillator, a fancy term for a tool that measures the speed and change of price movements. It ranges from 0 to 100 and is typically displayed below a price chart.
Imagine the RSI as a traffic signal for stocks. When it’s high (usually above 70), it’s like a red light, suggesting the stock might be overbought. This could mean it’s time for a potential reversal or at least a pause in the upward trend. Conversely, when the RSI is low (usually below 30), it’s like a green light, signaling that the stock might be oversold. This could indicate a potential buying opportunity, as the price might be due for a bounce.
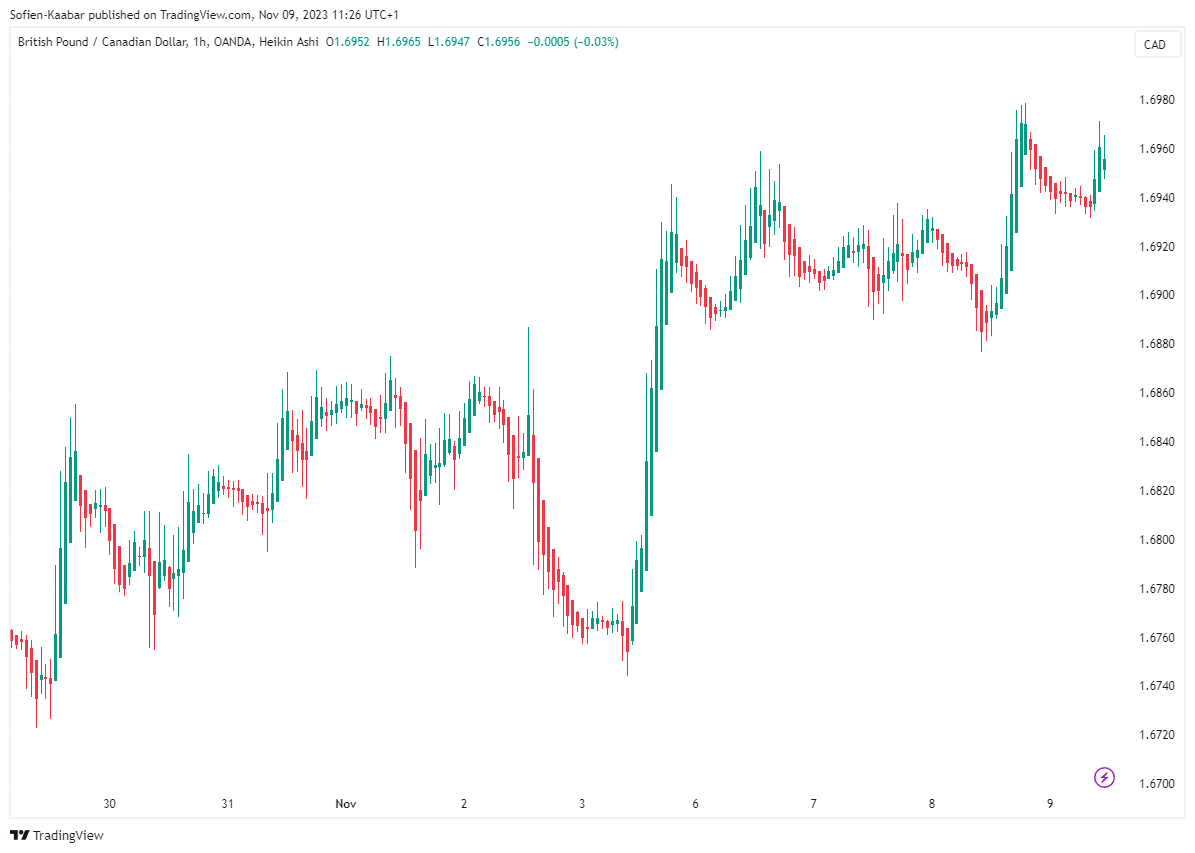
Heikin-Ashi, Japanese for “average pace,” is a different way of representing price movements on a chart. Unlike traditional candlesticks, Heikin-Ashi candles use a formula to average prices, creating a smoother appearance.
Picture Heikin-Ashi as your wise, calm friend in the world of financial charts. It filters out the noise, making it easier to spot trends. Each candle considers the previous candle’s close, open, high, and low, creating a more continuous visual. Basically, it’s a smoothed version of the price action.
If you want to see more of my work, you can visit my website for the books catalogue by simply following this link:
The Heikin-Ashi RSI
The Heikin-Ashi RSI (HA-RSI) uses both indicators to create a new one with its own rules and conditions. The steps required to create the HA-RSI
Calculate the Heikin-Ashi candlesticks on the regular candlesticks.
Calculate a candlestick-RSI on the Heikin-Ashi candlesticks.
Use the following code to generate the indicator in a new panel:
// This source code is subject to the terms of the Mozilla Public License 2.0 at https://mozilla.org/MPL/2.0/
// © Sofien-Kaabar

//@version=5
indicator("K's Heikin RSI", overlay = false)
lookback = input(defval = 21, title = 'Lookback')
open_heikin  = (open[1] + close[1]) / 2
high_heikin  = math.max(high[1], high, close)
low_heikin   = math.min(low[1], low, close)
close_heikin = (open + close + high + low) / 4
open_price  = ta.rsi(open_heikin, lookback)
high_price  = ta.rsi(high_heikin, lookback)
low_price   = ta.rsi(low_heikin, lookback)
close_price = ta.rsi(close_heikin, lookback)
palette = close_price > open_price ? color.rgb(117, 193, 255) : color.rgb(255, 118, 118)
plotcandle(open_price, high_price, low_price, close_price, color = palette)
hline(85)
hline(15)
hline(50)
And use the following code to generate the signals on the indicator using its default strategy:
// This source code is subject to the terms of the Mozilla Public License 2.0 at https://mozilla.org/MPL/2.0/
// © Sofien-Kaabar

//@version=5
indicator("K's Heikin RSI", overlay = true)
lookback = input(defval = 21, title = 'Lookback')
open_heikin  = (open[1] + close[1]) / 2
high_heikin  = math.max(high[1], high, close)
low_heikin   = math.min(low[1], low, close)
close_heikin = (open + close + high + low) / 4
open_price  = ta.rsi(open_heikin, lookback)
high_price  = ta.rsi(high_heikin, lookback)
low_price   = ta.rsi(low_heikin, lookback)
close_price = ta.rsi(close_heikin, lookback)
buy = low_price < 15 and close_price > 15 and open_price < close_price and close_price > close_price[1]
sell = high_price > 85 and close_price < 85 and open_price > close_price and close_price < close_price[1]
extreme_buy  = close_price > 15 and low_price[1]  < 10 and low_price[2]  < 10
extreme_sell = close_price < 85 and high_price[1] > 90 and high_price[2] > 90
plotshape(buy,  style = shape.triangleup, color = color.green, location =  location.belowbar, size = size.small)
plotshape(sell,  style = shape.triangledown, color = color.red, location =  location.abovebar, size = size.small)
plotshape(extreme_buy,  style = shape.triangleup, color = color.blue, location =  location.belowbar, size = size.small)
plotshape(extreme_sell,  style = shape.triangledown, color = color.black, location =  location.abovebar, size = size.small)
The strategy is simple:
A bullish signal is generated whenever the HA-RSI low is below 15 and the HA-RSI close is above 15. Similarly, the HA-RSI open is below the HA-RSI close and the HA-RSI close is greater than the previous HA-RSI close.
A bearish signal is generated whenever the HA-RSI high is above 85 and the HA-RSI close is below 85. Similarly, the HA-RSI open is above the HA-RSI close and the HA-RSI close is below the previous HA-RSI close.
An extreme bullish signal is generated whenever the HA-RSI close is greater than 15 and the two previous HA-RSI lows are below 10.
An extreme bearish signal is generated whenever the HA-RSI close is below 85 and the two previous HA-RSI highs are above 90.
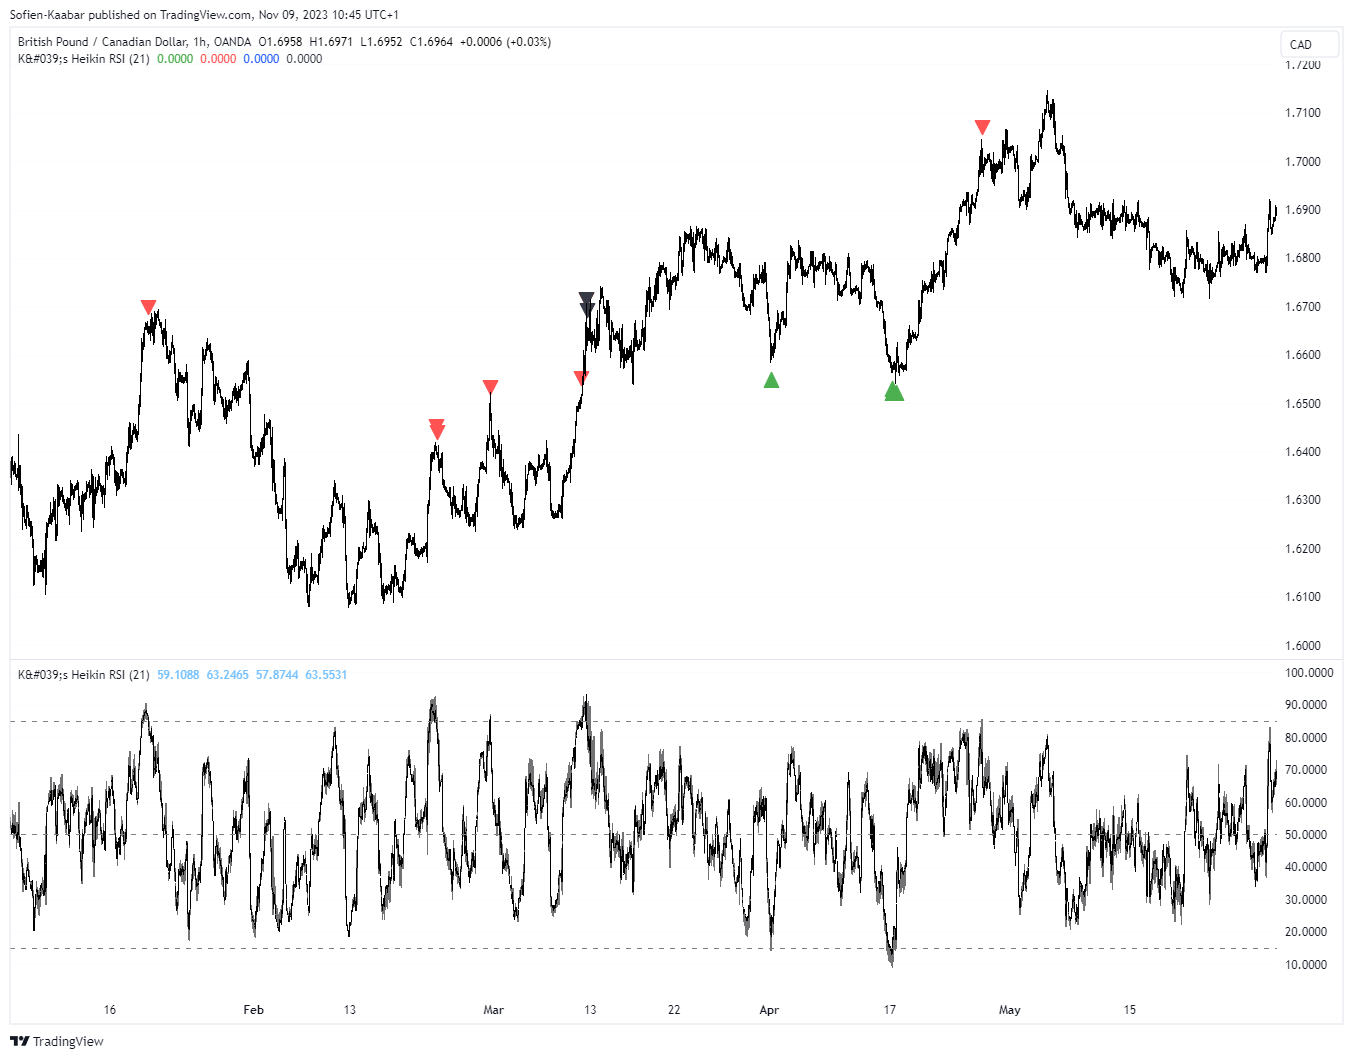
The following chart shows a few signals from the Heikin-Ashi RSI.
The following chart shows more signals from the Heikin-Ashi RSI.
To sum up, every indicator comes with baggage. This one is no different. Make sure to treat it as you would treat the others, by properly back-testing it and assume that it will fail you at some point in time.
Remember that no single indicator guarantees success. Indicators are tools, not crystal balls. They provide insights, but market conditions can change, and risks are inherent. Also, avoid relying solely on one indicator. Combining multiple indicators can provide a more comprehensive view. Look for confluence, where signals from different indicators align.
You can also check out my other newsletter The Weekly Market Sentiment Report that sends weekly directional views every weekend to highlight the important trading opportunities using a mix between sentiment analysis (COT report, put-call ratio, etc.) and rules-based technical analysis.
If you liked this article, do not hesitate to like and comment, to further the discussion!


