
The Rescaled Range Indicator
Presenting an Indicator from the Chaos World


Less popular indicators may harbor incredible strength in them when used right. This article discusses a price analysis indicator called the rescaled range indicator.
The Rescaled Range Indicator
The Rescaled Range (R/S) indicator is a statistical tool originally developed by hydrologist Harold Edwin Hurst (hence its connection to the Hurst exponent). It’s primarily used to detect persistence, anti-persistence, or randomness in a time series (e.g., price data).
Here’s how it works:
For a window of data, it calculates the range of cumulative deviations from the mean.
This range is then rescaled by dividing by the standard deviation.
By analyzing how this value scales with window size, you can estimate the Hurst exponent, but R/S on its own helps assess volatility clustering or trends.
We can interpret a rising R/S value as a trend formation. A falling R/S value refers to mean-reverting or anti-persistent behavior. A flat one represents random walk behavior.
The way to build this indicator can be summed up as follows:
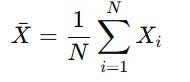
Compute the mean.
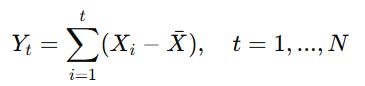
Compute the cumulative deviance from the mean.
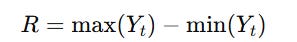
Compute the range.
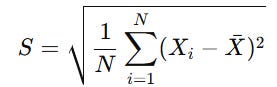
Compute the standard deviation.
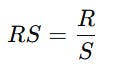
The rescaled range is given by the following formula.
Do you want to master Deep Learning techniques tailored for time series, trading, and market analysis🔥? My book breaks it all down from basic machine learning to complex multi-period LSTM forecasting while going through concepts such as fractional differentiation and forecasting thresholds. Get your copy here 📖!
Coding the Rescaled Range Indicator
The indicator can be coded in Pine Script as follows:
//@version=5
indicator("Rescaled Range (R/S)", overlay=false)
// Input parameters
length = input.int(14, minval=10, title="Window Length")
src = input.source(close, title="Source")
// Mean of window
mean = ta.sma(src, length)
// Deviation from mean
dev = src - mean
// Cumulative deviance
var float cumulative = na
cumulative := nz(cumulative[1]) + dev
// Highest and lowest cumulative deviance over window
maxY = ta.highest(cumulative, length)
minY = ta.lowest(cumulative, length)
// Range
R = maxY - minY
// Standard deviation
S = ta.stdev(src, length)
// Rescaled Range
RS = S != 0 ? R / S : na
plot(RS, color=color.new(color.blue, 0), title="Rescaled Range")
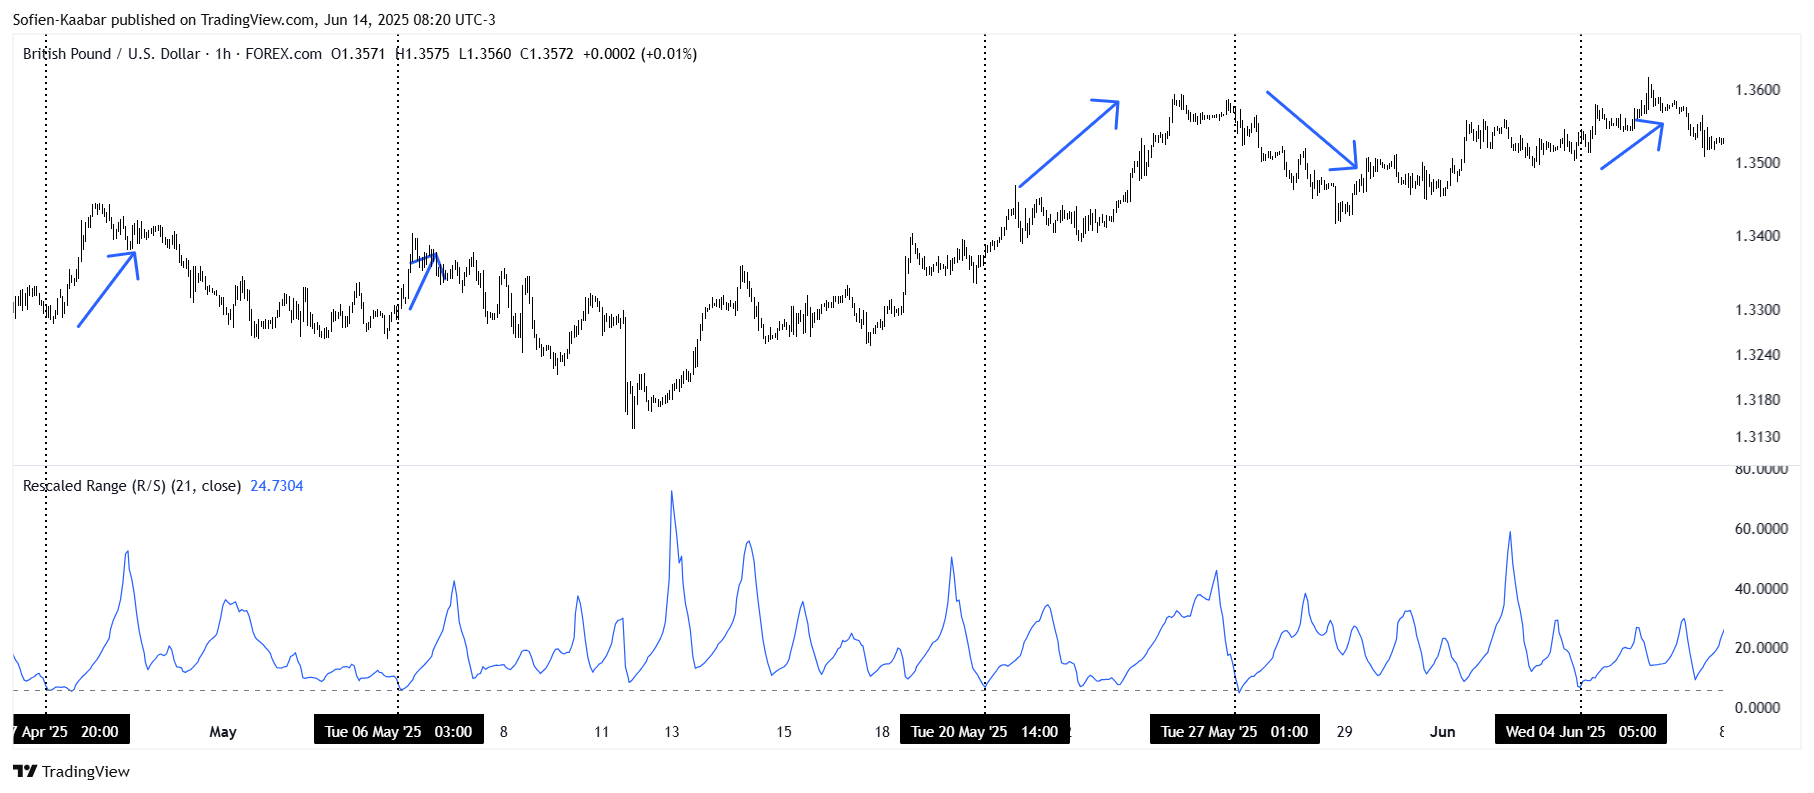
hline(1, "Reference", color=color.gray)The following chart shows the interpretation of the indicator.
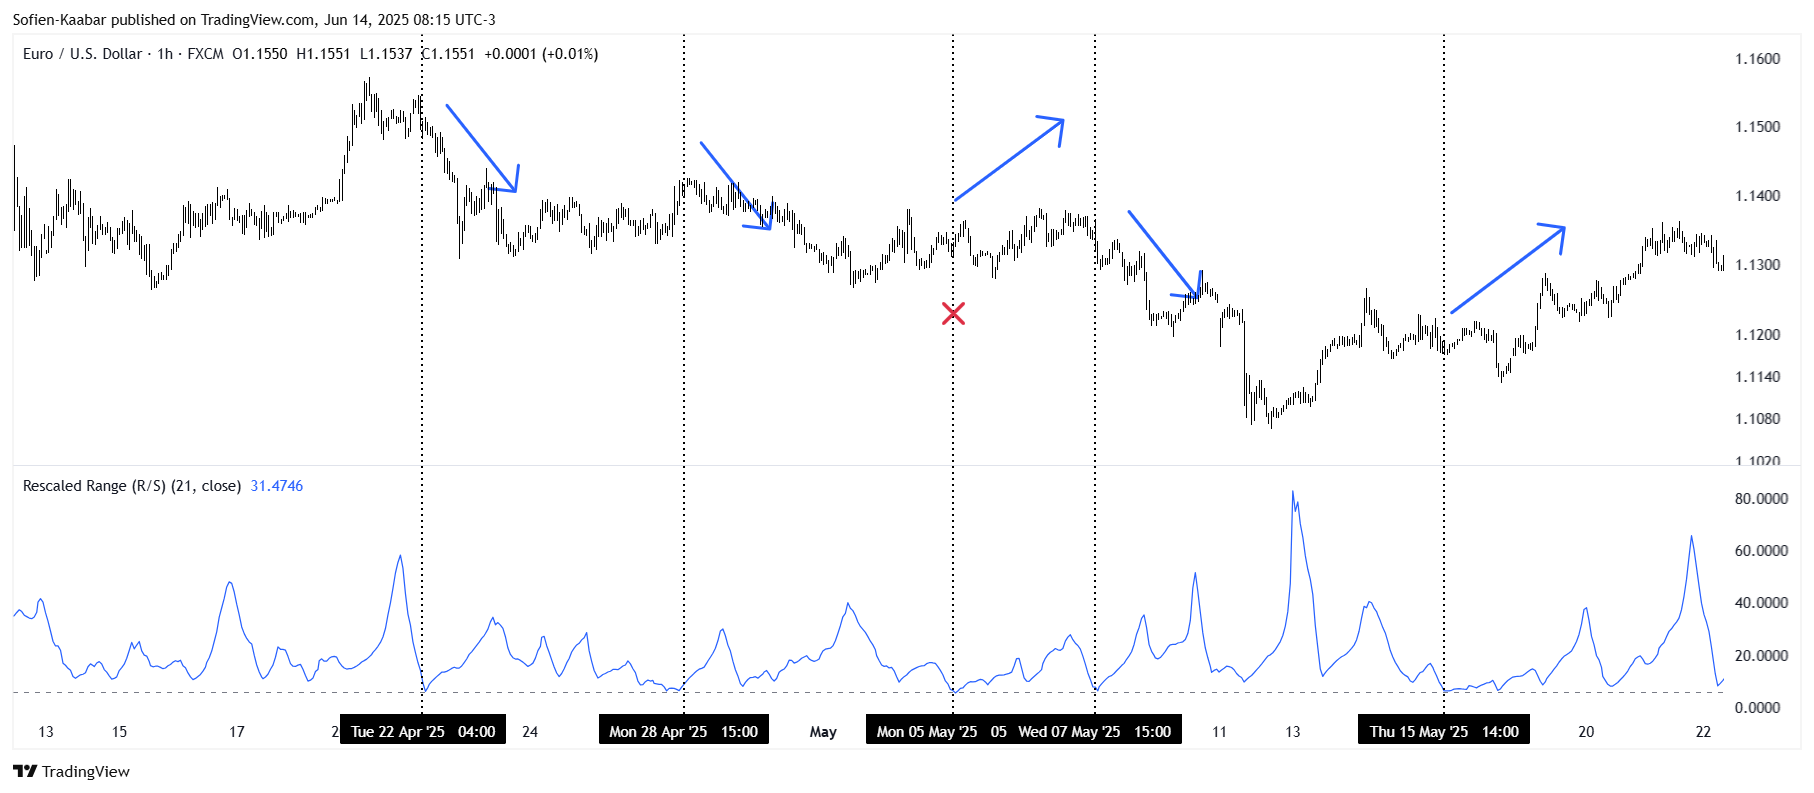
The best way to use the indicator is as follows:
Whenever it approaches the historical support line, we can assume that trend behavior will begin. This is also reinforced when we look at the current market regime. If it’s flat, then it may start trending.
The R/S indicator doesn’t show you the directional of the move, but may refer to a structural change in the market.
Every week, I analyze positioning, sentiment, and market structure. Curious what hedge funds, retail, and smart money are doing each week? Then join hundreds of readers here in the Weekly Market Sentiment Report 📜 and stay ahead of the game through chart forecasts, sentiment analysis, volatility diagnosis, and seasonality charts.
Free trial available🆓
