


The Rapid Trend Trading Strategy
Creating a Trend-Following Strategy Using the Hull Average


Trend-following strategies come in all shapes and forms. This article proposes an algorithmic way of confirming a change in trend using the Hull moving average as an example.
I have released a new book after the success of my previous one “Trend Following Strategies in Python”. It features advanced contrarian indicators and strategies with a GitHub page dedicated to the continuously updated code. If you feel that this interests you, feel free to visit the below Amazon link (which contains a sample), or if you prefer to buy the PDF version, you could check the link at the end of the article.
Contrarian Trading Strategies in Python
Amazon.com: Contrarian Trading Strategies in Python: 9798434008075: Kaabar, Sofien: Bookswww.amazon.com
The Hull Moving Average
Moving averages help us confirm and ride the trend. They are the most known technical indicator and this is because of their simplicity and their proven track record of adding value to the analyses. We can use them to find support and resistance levels, stops and targets, and to understand the underlying trend. This versatility makes them an indispensable tool in our trading arsenal.
What interests us to build the Hull moving average is the linear-weighted moving average. The most recent observation has the biggest weight and each one prior to it has a progressively decreasing weight. Intuitively, it has less lag than the other moving averages but it is also the least used, and hence, what it gains in lag reduction, it loses in popularity.

Basically, if we have a dataset composed of two numbers [1, 2] and we want to calculate a linear weighted average, then we will do the following:
(2 x 2) + (1 x 1) = 5
5 / 3 = 1.66
This assumes a time series with the number 2 as being the most recent observation. Now that we have understood what a weighted moving average is, we can proceed by presenting the Hull moving average, a powerful trend-following early system.
The Hull moving average uses the weighted moving average as a building block and it is calculated following the below steps:
Choose a lookback period such as 20 or 100 and calculate the weighted moving average of the closing price.
Divide the lookback period found in the first step and calculate the weighted moving average of the closing price using this new lookback period. If the number cannot by divided by two, then take the closest number before the comma (e.g. a lookback of 15 can be 7 or 8 as the second lookback).
Multiply the second weighted moving average by two and subtract from it the first weighted moving average.
As a final step, take the square root of the first lookback (e.g. if you have chosen a lookback of 100, then the third lookback period is 10) and calculate the weighted moving average on the latest result we have had in the third step. Be careful not to calculate it on market prices.
Therefore, if we choose a lookback period of 100, we will calculate on 100 lookback period, then on 50, and finally, on 10 applied to the latest result.
Creating the Strategy
The strategy is not the usual moving average cross as its idea is that whenever the market crosses over or under its moving average, we must wait for the pull-back before riding the new implied trend, therefore, we will be coding the following conditions:
A long (Buy) signal is generated whenever the market surpasses the 50-period Hull moving average and then shapes a pull-back towards the moving average through at least its low.
A short (Sell) signal is generated whenever the market breaks the 50-period Hull moving average and then shapes a pull-back towards the moving average through at least its high.

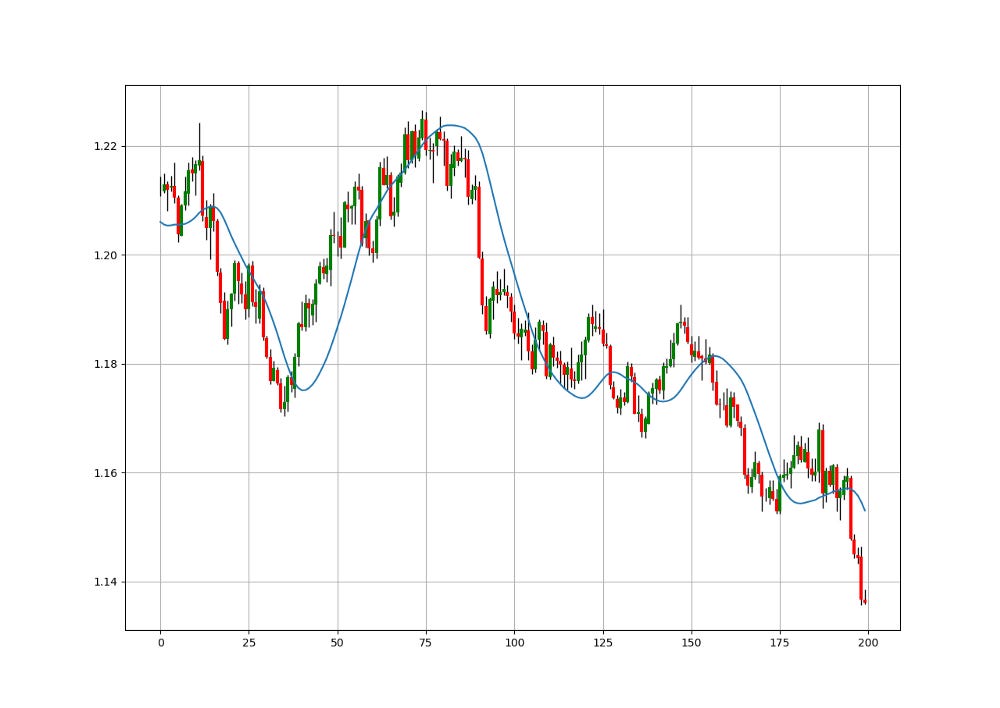
Take a look at the above chart on the USDCAD. Notice the first bearish signal where after a big red candle the market pulled-back to the moving average from where a bearish signal was generated. The next bearish signal is the same and has performed significantly well. Take a look at around point 37 in time, we see that the market has surpassed the moving average but no bullish signal was generated, why is this? Notice how the first bullish candle that closes above the moving average was never followed by one that pulls-back towards the moving average. This does not constitute a valid bullish signal.

def signal(Data, high_column, low_column, close_column, ma_column, buy_column, sell_column):

    Data = adder(Data, 10)

    for i in range(len(Data)):

        # Bullish Signal
        if Data[i, close_column] > Data[i, ma_column] and Data[i - 1, close_column] < Data[i - 1, ma_column]:

            for a in range(i + 1, len(Data)):

                if Data[a, low_column] <= Data[a, ma_column] and Data[a, close_column] > Data[a, ma_column] and \
                   Data[a - 1, close_column] > Data[a - 1, ma_column]:

                    Data[a, buy_column] = 1
                    break

                elif Data[a, sell_column] != 0:
                    break

                elif Data[a - 1, sell_column] != 0:
                    break

                else:
                    continue

        # Bearish Signal
        elif Data[i, close_column] < Data[i, ma_column] and Data[i - 1, close_column] > Data[i - 1, ma_column]:

            for a in range(i + 1, len(Data)):

                if Data[a, high_column] >= Data[a, ma_column] and Data[a, close_column] < Data[a, ma_column] and \
                   Data[a - 1, close_column] < Data[a - 1, ma_column]:

                    Data[a, sell_column] = -1
                    break

                elif Data[a, buy_column] != 0:
                    break

                elif Data[a - 1, buy_column] != 0:
                    break

                else:
                    continue

    return Data
If you want to see how to create all sorts of algorithms yourself, feel free to check out Lumiwealth. From algorithmic trading to blockchain and machine learning, they have hands-on detailed courses that I highly recommend.
Learn Algorithmic Trading with Python Lumiwealth
Learn how to create your own trading algorithms for stocks, options, crypto and more from the experts at Lumiwealth. Click to learn more
Summary
To sum up, what I am trying to do is to simply contribute to the world of objective technical analysis which is promoting more transparent techniques and strategies that need to be back-tested before being implemented. This way, technical analysis will get rid of the bad reputation of being subjective and scientifically unfounded.
I recommend you always follow the the below steps whenever you come across a trading technique or strategy:
Have a critical mindset and get rid of any emotions.
Back-test it using real life simulation and conditions.
If you find potential, try optimizing it and running a forward test.
Always include transaction costs and any slippage simulation in your tests.
Always include risk management and position sizing in your tests.
Finally, even after making sure of the above, stay careful and monitor the strategy because market dynamics may shift and make the strategy unprofitable.