
The Parabolic RSI Trading Strategy in TradingView
Learn to Combine the Parabolic SAR and the RSI in a Trading Strategy


Structured trading strategies aim to improve the predictability of markets through combining different techniques to come up with a market opinion. This article presents the parabolic RSI strategy.
The RSI and the Parabolic SAR
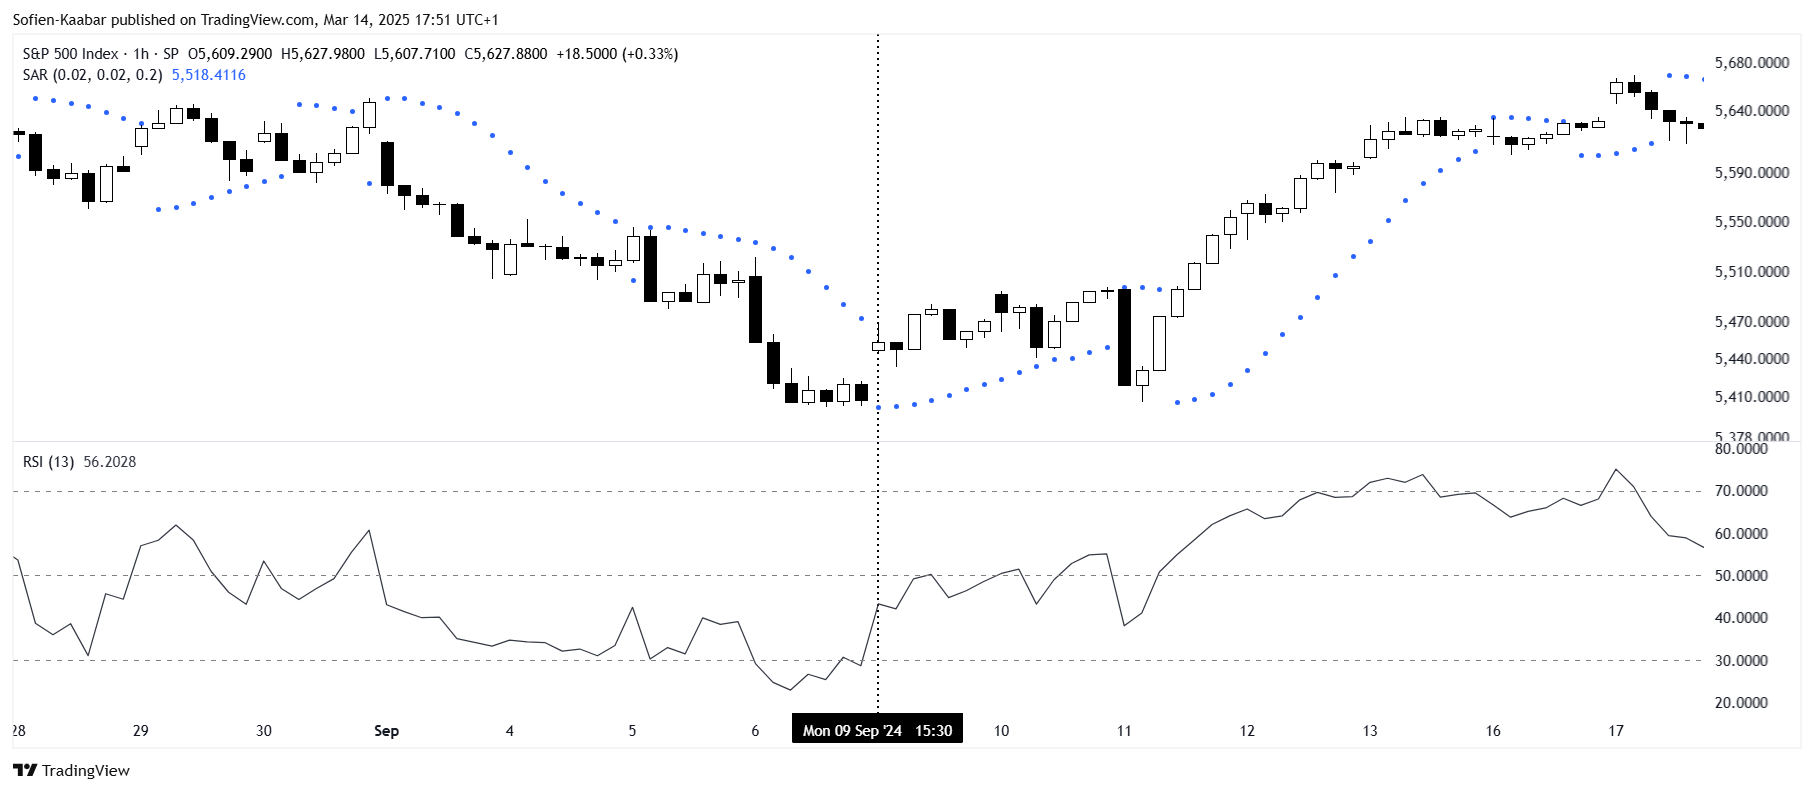
The RSI is a momentum oscillator developed by J. Welles Wilder. It measures the speed and change of price movements and helps identify overbought or oversold conditions. It’s bounded between 0 and 100 with 30 indicating oversold conditions and 70 indicating overbought conditions.
In contrast, the parabolic SAR is a trend-following indicator, also created by Wilder. It helps determine entry and exit points by indicating when the price might be reversing.
Appears as dots above or below price bars:
Below price = uptrend (bullish).
Above price = downtrend (bearish).
When the dots flip it signals a possible trend reversal.
The Parabolic RSI Trading Strategy
This strategy combines both indicators into one system. Here’s how it goes:
Calculate a 13-period RSI on the close prices.
Apply the parabolic SAR on the close prices.
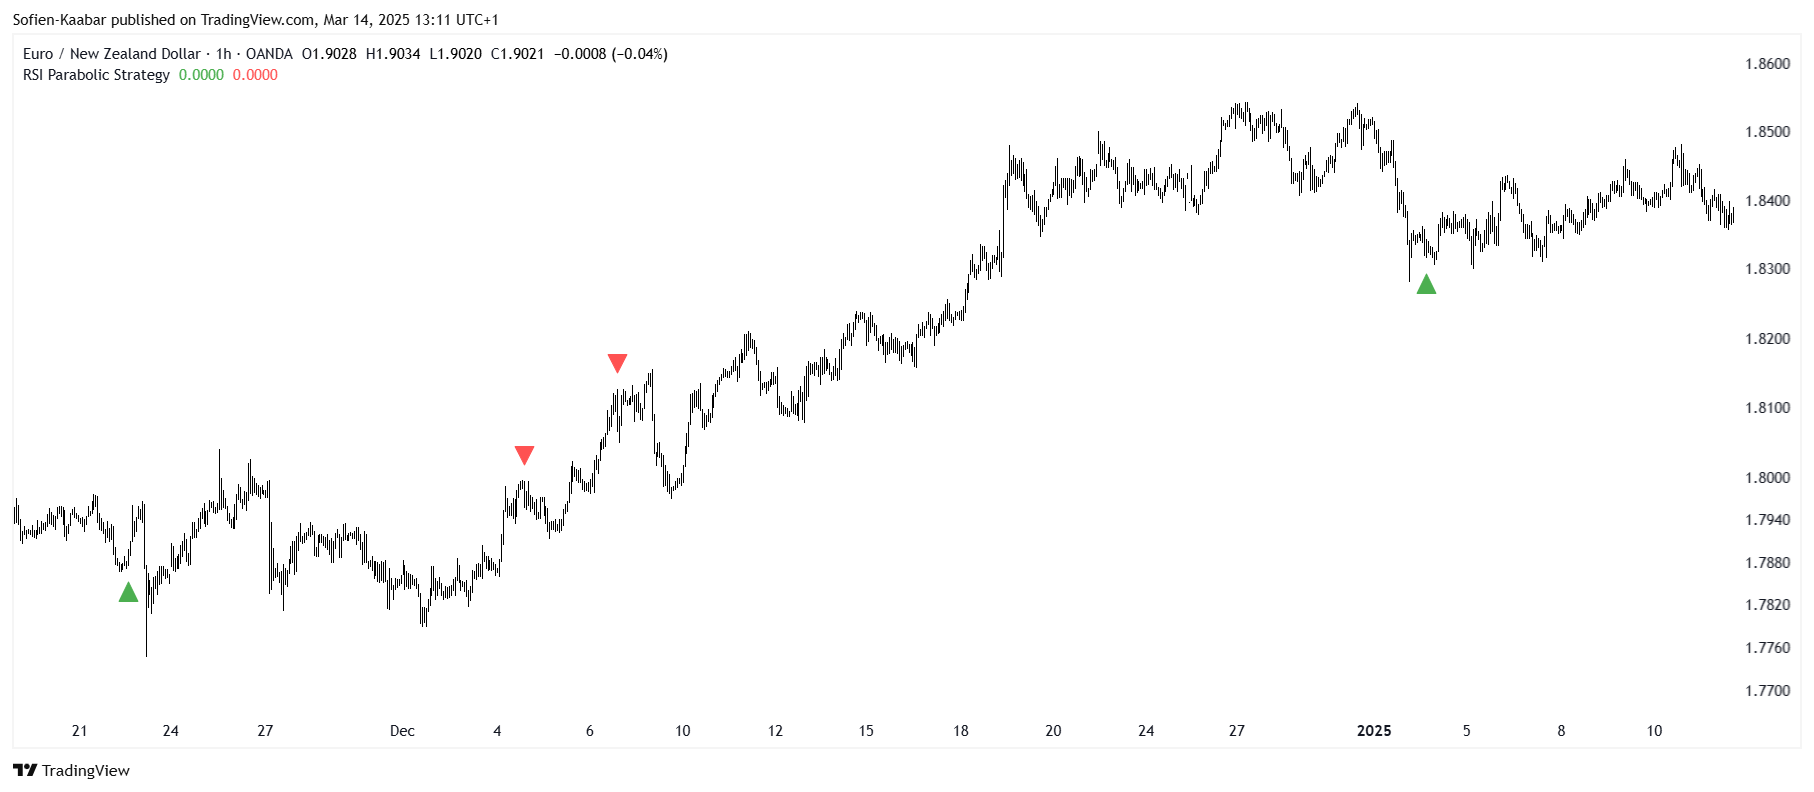
A bullish signal is generated whenever the RSI surpasses 30 while the close price is above the parabolic SAR.
A bearish signal is generated whenever the RSI breaks 70 while the close price is below the parabolic SAR.

The following chart shows a few signals generated using the strategy.

Use the following code to generate the trading strategy.
// This source code is subject to the terms of the Mozilla Public License 2.0 at https://mozilla.org/MPL/2.0/
// © Sofien-Kaabar

//@version=5
indicator("RSI Parabolic Strategy", overlay = true)

rsi = ta.rsi(close, 13)
sar = ta.sar(0.02, 0.02, 0.2)

buy = rsi > 30 and rsi[1] < 30 and close > sar
sell = rsi < 70 and rsi[1] > 70 and close < sar

plotshape(buy,  style = shape.triangleup,   color = color.green,  location =  location.belowbar, size = size.small)
plotshape(sell,  style = shape.triangledown,   color = color.red,  location =  location.abovebar, size = size.small)
The following chart shows a few signals generated using the strategy.
Check out my newsletter that sends weekly directional views every weekend to highlight the important trading opportunities using a mix between sentiment analysis (COT report, put-call ratio, etc.) and rules-based technical analysis.
