


The Parabolic Stop-and-Reverse is a trend following indicator that helps filter the trending moves. It is a widely used indicator and comes in the form of an overlay line (or dots) that follow the price action. This article discusses a way of transforming this indicator into a contrarian one for fun.
The Fibonacci Trading Book is finally out! Filled with Fibonacci-based trading methods (tools, indicators, patterns, and strategies), this book will guide you through improving your trading and analysis by incorporating an important technical analysis approach that is Fibonacci (PDF Version available, see end of article).
The Fibonacci Trading Book
Amazon.com: The Fibonacci Trading Book: 9798394344046: Kaabar, Sofien: Booksamzn.to
Fusing the RSI With the Parabolic SAR
As is known, the RSI is the most popular contrarian indicator and is bounded between 0 and 100 and thus serves as a normalization tool for any underlying.
The main idea of the fusion is to normalize the values of the parabolic SAR between 0 and 100 thus understanding more its recent tops and bottoms, magnitude-wise. Since the Parabolic SAR is smoothed, it can help to know whenever it hits extreme levels when we apply the RSI’s normalization on it. The next Figure shows an example of the RSI and the Parabolic SAR.
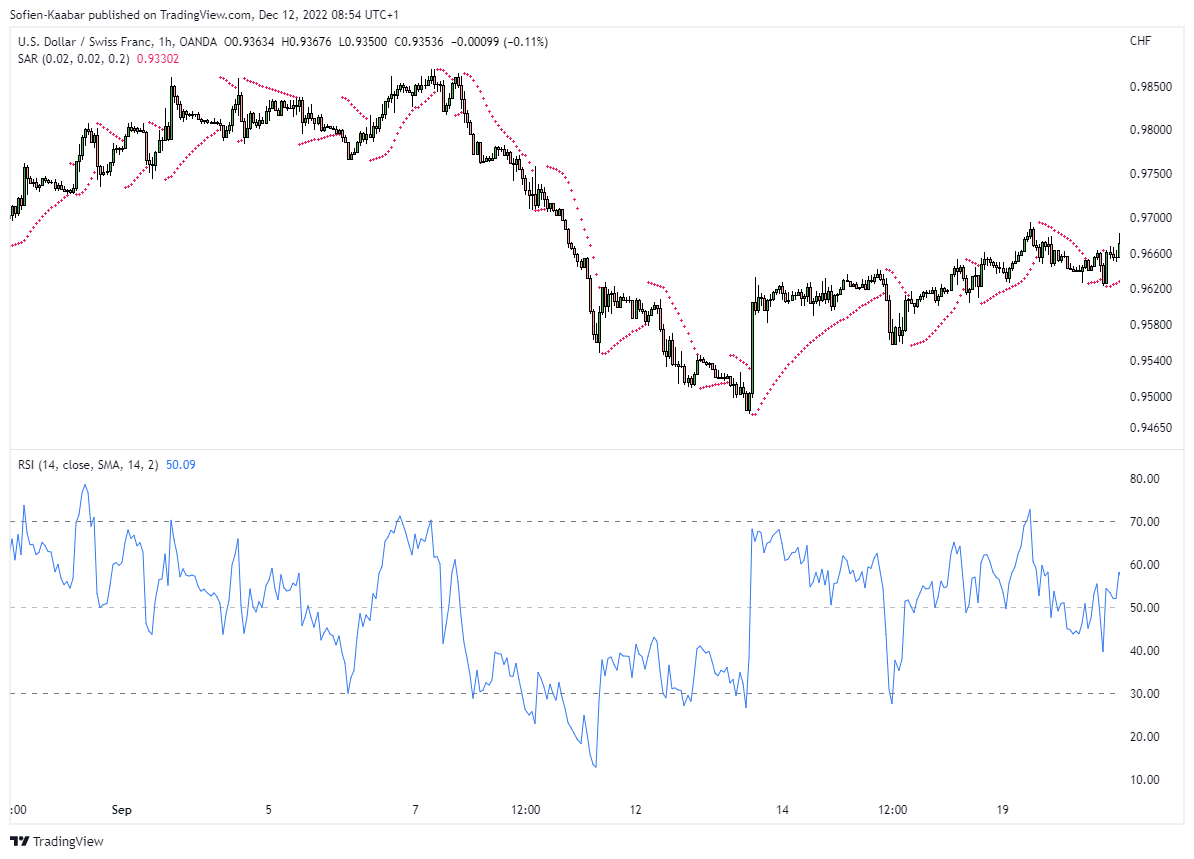
As a reminder, we will be applying the RSI’s function on the Parabolic SAR so as to get a new RSI indicator that we can call the Parabolic-RSI.
Creating the Parabolic-RSI in TradingView
In TradingView, it is simple to whip out any indicator and chart it alongside the price action. TradingView’s own programming language is called Pine Script and is relatively easy to understand. The next Figure shows the Parabolic RSI.
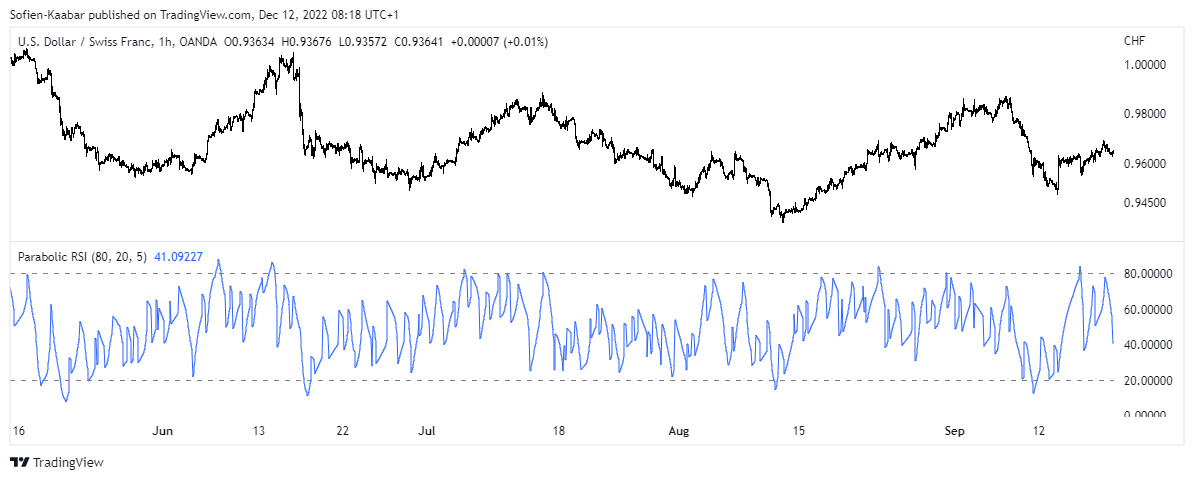
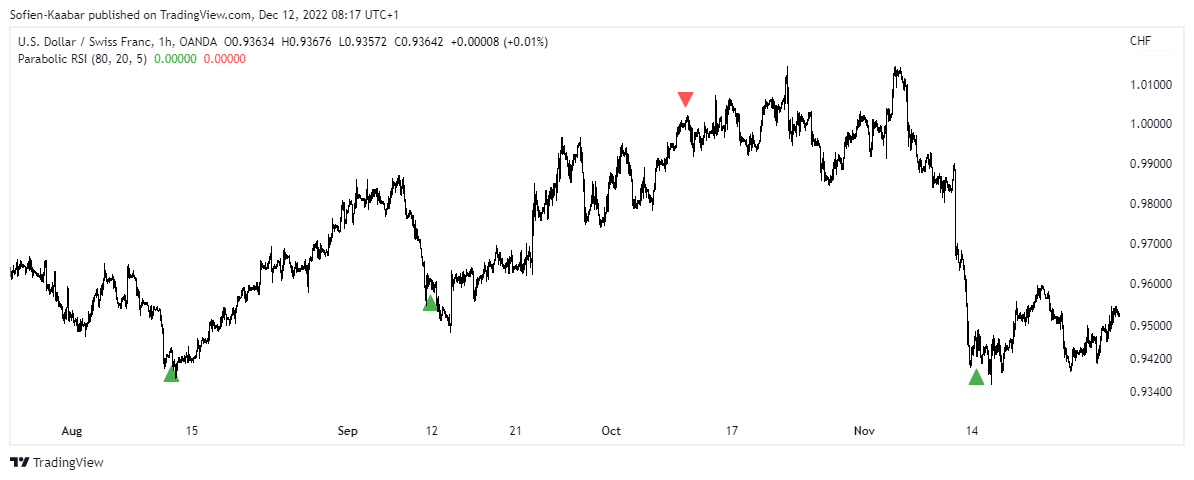
Notice how it is different from an RSI calculated on the market price. This may be an interesting view on market signals. We will now create a simple strategy on this indicator just to visually test some signals:
A long signal is generated whenever the Parabolic-RSI surpasses 20 after having been below it for at least 5 periods.
A short signal is generated whenever the Parabolic-RSI surpasses 80 after having been above it for at least 5 periods.
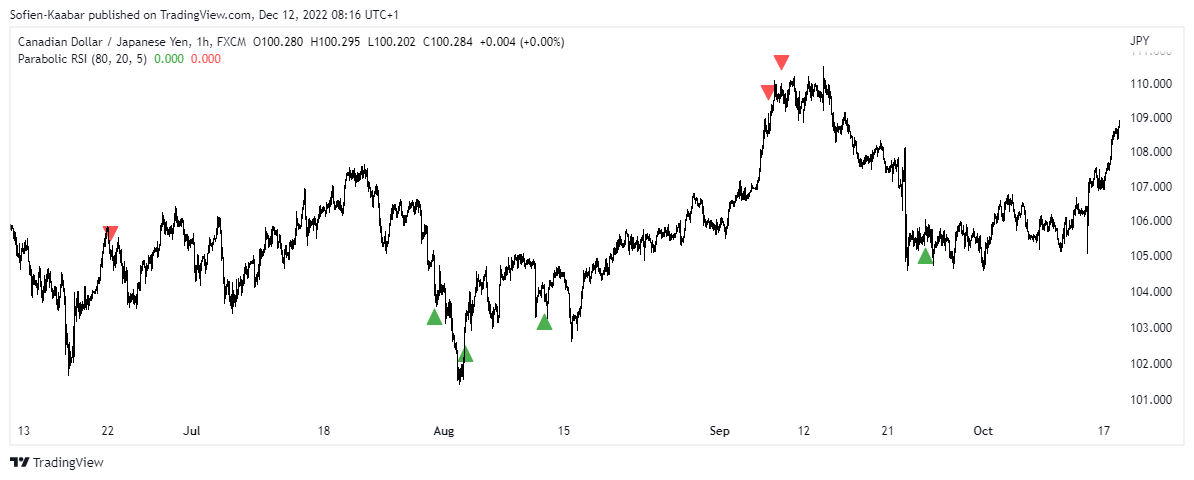
The next Figure shows a signal chart.
The full code of the indicator is as follows:
// This source code is subject to the terms of the Mozilla Public License 2.0 at https://mozilla.org/MPL/2.0/
// © Sofien-Kaabar

//@version=5
indicator("Parabolic RSI", overlay = true)

upper_barrier = input(defval = 80, title = 'Upper Barrier')
lower_barrier = input(defval = 20, title = 'Lower Barrier')
length = input(defval = 5, title = 'Lookback')

parabolic = ta.sar(0.02, 0.02, 0.2)
rsi = ta.rsi(parabolic, 21)

buy  = rsi > lower_barrier and rsi[1] < lower_barrier and rsi[2] < lower_barrier and rsi[3] < lower_barrier and rsi[4] < lower_barrier and rsi[5] < lower_barrier
sell = rsi < upper_barrier and rsi[1] > upper_barrier and rsi[2] > upper_barrier and rsi[3] > upper_barrier and rsi[4] > upper_barrier and rsi[5] > upper_barrier

plotshape(buy,  style = shape.triangleup, color = color.green, location =  location.belowbar, size = size.small)
plotshape(sell, style = shape.triangledown, color = color.red, location =  location.abovebar, size = size.small)
The next Figure shows a signal chart.
The PDF link for the Fibonacci Trading Book is the following (make sure to include your e-mail address in the notes part):
Pay Kaabar using PayPal.Me
Go to paypal.me/sofienkaabar and type in the amount. Since it’s PayPal, it’s easy and secure. Don’t have a PayPal…paypal.me