


Technical analysis is often presented as a discipline of precision, where exact price levels, clean patterns, and well-defined entries provide a repeatable trading advantage. In practice, however, markets exhibit a level of noise and structural instability that renders such precision largely illusory.
This post argues that the apparent accuracy of technical levels is not evidence of predictive power, but rather a byproduct of randomness, visual bias, and post-hoc interpretation. Through statistical reasoning and simulation, let’s demonstrate that precise levels emerge naturally in noisy systems, and that focusing on exact entries often leads to overconfidence and fragile strategies.
Introduction
Spend enough time around traders and you will notice a recurring behavior: the obsession with exactness.
“Support is at 1.0823”
“The breakout triggers at 4,215.50”
“Entry must be within 2 pips”
This level of precision suggests a deterministic view of markets. The implicit belief is that price reacts to specific numbers, as if these levels possess intrinsic significance.
But markets are not engineered systems. They are probabilistic, decentralized, and noisy. The uncomfortable reality is this:
Precision in technical analysis is often an illusion constructed after the fact.
Where the Illusion Comes From
The illusion of precision emerges from three main sources:
Visual Anchoring
Humans are exceptionally good at imposing structure on randomness. When looking at charts:
We draw lines where price “reacted”
We align highs and lows into clean levels
We ignore near-misses
A level that “worked” becomes memorable. Levels that failed are quietly discarded. This creates a biased mental dataset where precision appears consistent.
Retrospective Alignment
Levels are rarely defined before the move. Instead, they are adjusted after observing price behavior.
A trader might:
Draw a support line slightly above or below prior lows
Adjust it until it visually “fits”
Conclude that price respected the level
This process creates artificial precision. The level did not predict the reaction. It was fitted to it.
Discrete Representation of Continuous Processes
Price is quoted in discrete units (ticks, pips), but the underlying process is continuous and noisy. Treating price as if it must react at a single exact value ignores:
Execution dispersion
Order book depth
Liquidity fragmentation
What appears as a precise reaction is often just a range compressed into a number.
Randomness Produces “Clean” Levels
One of the most overlooked facts in trading is that random processes can generate visually perfect structures.
Even a random walk will produce:
Horizontal levels where price clusters
Sharp reversals at seemingly exact points
Trendlines that appear respected
This is not evidence of structure. It is a consequence of:
Finite samples
Variance clustering
Human pattern recognition
Simulation: Precision Without Meaning
To illustrate this, we generate a random walk and extract “levels” from it.
The goal is simple: show that even in pure noise, price appears to react to precise levels.
This script:
Generates a random walk
Identifies local highs and lows
Plots horizontal “support/resistance” levels
Shows how often price appears to react near them
import numpy as np
import pandas as pd
import matplotlib.pyplot as plt

np.random.seed(7)

# --- Generate Random Walk ---
n = 1500
returns = np.random.normal(0, 0.01, n)
price = 100 + np.cumsum(returns)

df = pd.DataFrame({'price': price})

# --- Identify Local Extremes ---
window = 5
df['max'] = df['price'].rolling(window).max()
df['min'] = df['price'].rolling(window).min()

df['is_resistance'] = df['price'] == df['max']
df['is_support'] = df['price'] == df['min']

res_levels = df.loc[df['is_resistance'], 'price']
sup_levels = df.loc[df['is_support'], 'price']

# --- Plot Price and Levels ---
plt.figure()
plt.plot(df['price'], label='Price')

# Plot a subset of levels for clarity
for level in res_levels.sample(10, random_state=1):
    plt.axhline(level, linestyle='--')

for level in sup_levels.sample(10, random_state=1):
    plt.axhline(level, linestyle=':')

plt.title("Random Walk with 'Support' and 'Resistance'")
plt.xlabel("Time")
plt.ylabel("Price")
plt.legend()
plt.show()

# --- Measure "Precision" ---
tolerance = 0.002  # ~0.2%

hits = 0
tests = 0

levels = pd.concat([res_levels, sup_levels])

for level in levels:
    distances = np.abs(df['price'] - level) / level
    near = distances < tolerance
    if near.sum() > 1:
        hits += 1
    tests += 1

print(f"Levels with multiple 'reactions': {hits}/{tests}")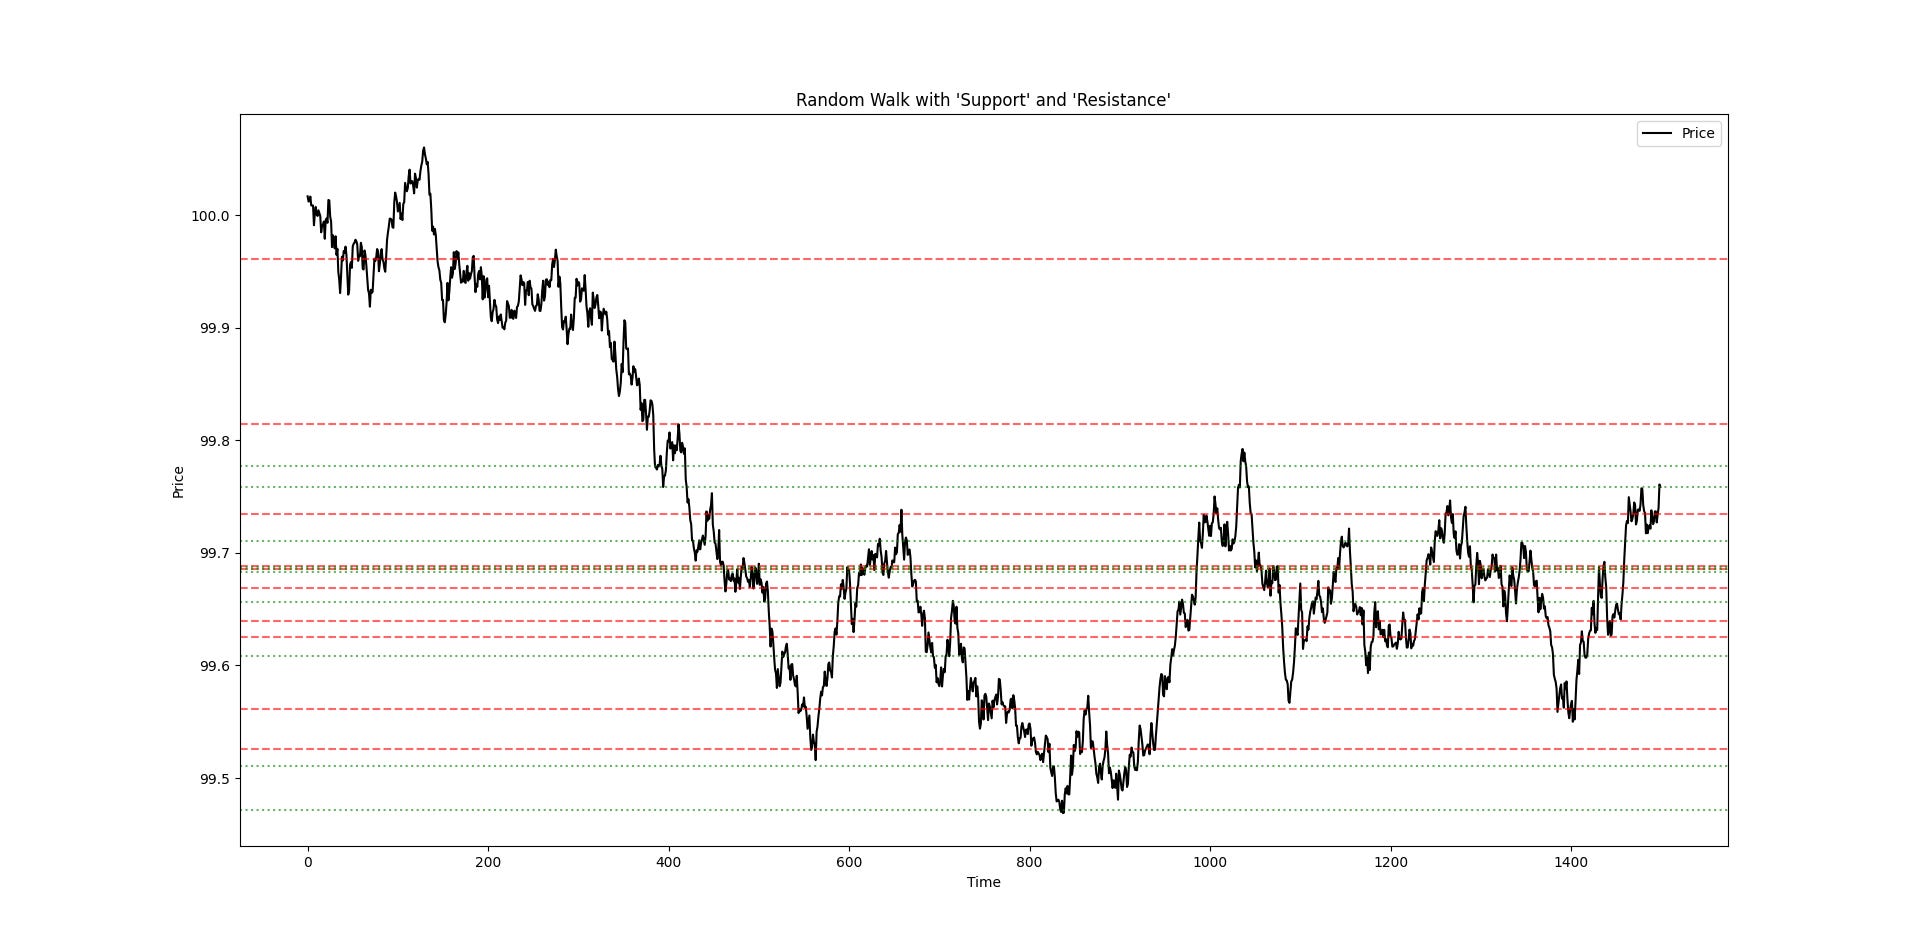
What This Shows
Despite the data being completely random, you will observe:
Price “respecting” levels multiple times
Clean horizontal structures
Repeated touches within tight tolerances
This leads to a dangerous conclusion:
Precision can emerge without any underlying edge.
The Problem with Exact Entries
The belief in precision directly affects execution.
Traders often:
Wait for exact levels and miss trades
Place tight stops based on arbitrary precision
Overfit entry conditions
This introduces fragility:
Small deviations invalidate the setup
Slippage destroys expected performance
Real-world execution diverges from theory
In reality, if an edge exists, it should be robust to small perturbations.
If moving your entry by a few ticks destroys performance, the edge is likely not real.
Zones vs Points: A Quantitative Perspective
A more realistic framework treats levels as distributions, not points.
Instead of asking: “Does price react at this level?”
A better question is: “Does price behavior change within this region?”
This shifts the focus from:
Exact price → Probability mass
Precision → Stability
Mathematically, this aligns with how noisy systems behave:
Reactions are spread
Execution is dispersed
Outcomes are probabilistic
Precision is often a hidden form of overfitting.
When traders:
Optimize entry levels
Fine-tune thresholds
Adjust lines to past data
They are effectively fitting noise.
The result is a strategy that:
Looks clean in hindsight
Fails in forward testing
The cleaner the chart, the more suspicious it should be.
Implications for Strategy Design
If precision is an illusion, then strategy design must adapt.
Robust strategies should:
Tolerate variation in entry
Perform similarly across nearby levels
Maintain performance under noise
This implies that: Edge, if it exists, is coarse, not precise.
Conclusion
Technical analysis often gives the impression that markets operate with surgical precision. In reality, this precision is largely a visual artifact, reinforced by bias and selective observation.
Random processes can generate levels that appear meaningful, and traders, conditioned to seek structure, interpret these as signals.
The real challenge is not identifying levels, but determining whether those levels carry information beyond what randomness can produce.
In most cases, they do not.
And once that is understood, the obsession with precision becomes unnecessary.