The Mother of Moving Averages
Is it Possible to Aggregate Moving Averages Into One?
Moving averages are used as trend filters and dynamic support and resistance levels and as such they are extremely useful despite their lagging properties. This article will discuss a moving average aggregation such as it changes need to choose a lookback period.
It is finally out! My newest book with O’Reilly Media on candlestick pattern recognition is now available on Amazon! The book features a huge number of classic and modern candlestick patterns as it dwelves into the realm of technical analysis with different trading strategies. The book comes with its own GitHub and is dynamic in nature as it is continuously updated and questions are answered on the O’Reilly platform.
Mastering Financial Pattern Recognition
Amazon.com: Mastering Financial Pattern Recognition eBook : Kaabar, Sofien: Kindle Storewww.amazon.com
Moving Averages: A Primer
Moving averages are one of the key technical indicators that show the current trend, serve as trailing stops, and can even give trading signals. This versatility as made them one of the most used indicators in analysis.
To calculate a moving average, we simply divide the sum by the quantity using a specific lookback period. This means that if the lookback period is 20, we will take the latest 20 observation in time and divide them by their quantity which is 20.
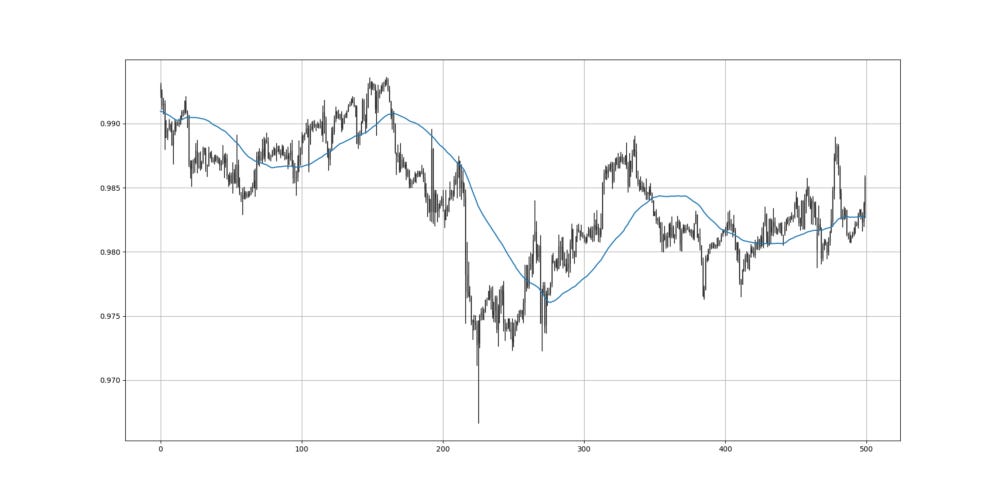
The following Figure shows EURCHF with its 60-period moving average.
The Mother of Moving Averages
The mother of moving averages is simply the average of the moving averages that have a lookback period from 2 to any lookback above 200. Basically, the steps needed to calculate it are as follows:
For each time step, calculate a moving average on the close prices starting by a lookback period of 2 until a lookback period of a minimum of 200.
For each time step, calculate the average of the current moving averages.
Calling it the mother of moving averages may be a bit of an overstretch especially that it retains a subjectivity part which is the maximum lookback period that is at least 200.
It is of course up to you to choose the maximum lookback period but generally, beween 200 and 400 should be enough to give interesting reaction points. For this article, we will calculate the moving averages from 2 periods to 400 periods.
The following Figure shows an example of the mother of moving averages.
The code you use can be as follows (among many other faster alternatives):
import numpy as np

def add_column(data, times):

    for i in range(1, times + 1):

        new = np.zeros((len(data), 1), dtype = float)

        data = np.append(data, new, axis = 1)

    return data

def ma(data, lookback, close, position):

    data = add_column(data, 1)

    for i in range(len(data)):

            try:

                data[i, position] = (data[i - lookback + 1:i + 1, close].mean())

            except IndexError:

                pass

    return data

first_output_column = 4

for i in range(2, 402):

    my_data = ma(my_data, i, 3, first_output_column)

    column = column + 1

my_data = add_column(my_data, 1)

for i in range(len(my_data)):

    my_data[i, 404] = np.mean(my_data[i, 4:403])
Note that you must have an OHLC numpy array with historical data inside.
The following Figure shows an example of the mother of moving averages.
And finally, let’s compare the 400-period moving average with the mother of moving averages (which is the average from 2 lookback periods to 400 lookback periods).

As can be seen, the mother of moving averages is more reactive than the 400-period moving average and still retains the long-term ability of considering the long-term trend.
The key signal is to perform a contrarian trade whenever the market approaches the mother of moving averages and the moving average that represents the maximum lookback period (in the above example, it is 400). This may be rare but it provides a powerful signal.
If you want to see how to create all sorts of algorithms yourself, feel free to check out Lumiwealth. From algorithmic trading to blockchain and machine learning, they have hands-on detailed courses that I highly recommend.
Learn Algorithmic Trading with Python Lumiwealth
Learn how to create your own trading algorithms for stocks, options, crypto and more from the experts at Lumiwealth. Click to learn more
Summary
To sum up, what I am trying to do is to simply contribute to the world of objective technical analysis which is promoting more transparent techniques and strategies that need to be back-tested before being implemented. This way, technical analysis will get rid of the bad reputation of being subjective and scientifically unfounded.
I recommend you always follow the the below steps whenever you come across a trading technique or strategy:
Have a critical mindset and get rid of any emotions.
Back-test it using real life simulation and conditions.
If you find potential, try optimizing it and running a forward test.
Always include transaction costs and any slippage simulation in your tests.
Always include risk management and position sizing in your tests.
Finally, even after making sure of the above, stay careful and monitor the strategy because market dynamics may shift and make the strategy unprofitable.


