The Marubozu Pattern Recognition in TradingView
Coding a Marubozu Candlestick Pattern Scanner in TradingView
Candlestick patterns are a great addition to market analysis. Some may even consider them vital in research and trading. This article presents the Marubozu pattern and shows how to code a scanner in TradingView that detects it.
The Marubozu Pattern
Candlestick charts are among the most famous ways to analyze the time series visually. They contain more information than a simple line chart and have more visual interpretability than bar charts.
The Marubozu pattern is a one-candle configuration and symbolizes the most powerful directional candlestick as it lacks wicks.
The bullish Marubozu is composed of a bullish candlestick with a high equal to the close and low equal to the low. The following Figure shows a theoretical illustration of the bullish Marubozu.
The bearish Marubozu is composed of a bearish candlestick with a high equal to the open and low equal to the close. The following Figure shows a theoretical illustration of the bearish Marubozu.
You can also check out my other newsletter The Weekly Market Sentiment Report that sends tactical directional views every weekend to highlight the important trading opportunities using a mix between sentiment analysis (COT reports, Put-Call ratio, Gamma exposure index, etc.) and technical analysis.
Coding the Scanner in TradingView
The conditions of the pattern are relatively easy to code especially in a straightforward and simple coding language such as Pine Script, TradingView’s native language.
The aim of the scanner is to detect the Marubozu patterns using the following indications:
A green arrow for bullish Marubozu signals.
A red arrow for bearish Marubozu signals.
// This source code is subject to the terms of the Mozilla Public License 2.0 at https://mozilla.org/MPL/2.0/
// © Sofien-Kaabar

//@version=5
indicator("Marubozu Finder", overlay = true)

bullish_marubozu = close[1] > open[1] and high[1] == close[1] and low[1] == open[1]
bearish_marubozu = close[1] < open[1] and high[1] == open[1]  and low[1] == close[1]

plotshape(bullish_marubozu,  style = shape.triangleup,   color = color.green,  location =  location.belowbar, size = size.small)
plotshape(bearish_marubozu,  style = shape.triangledown, color = color.red,    location =  location.abovebar, size = size.small)
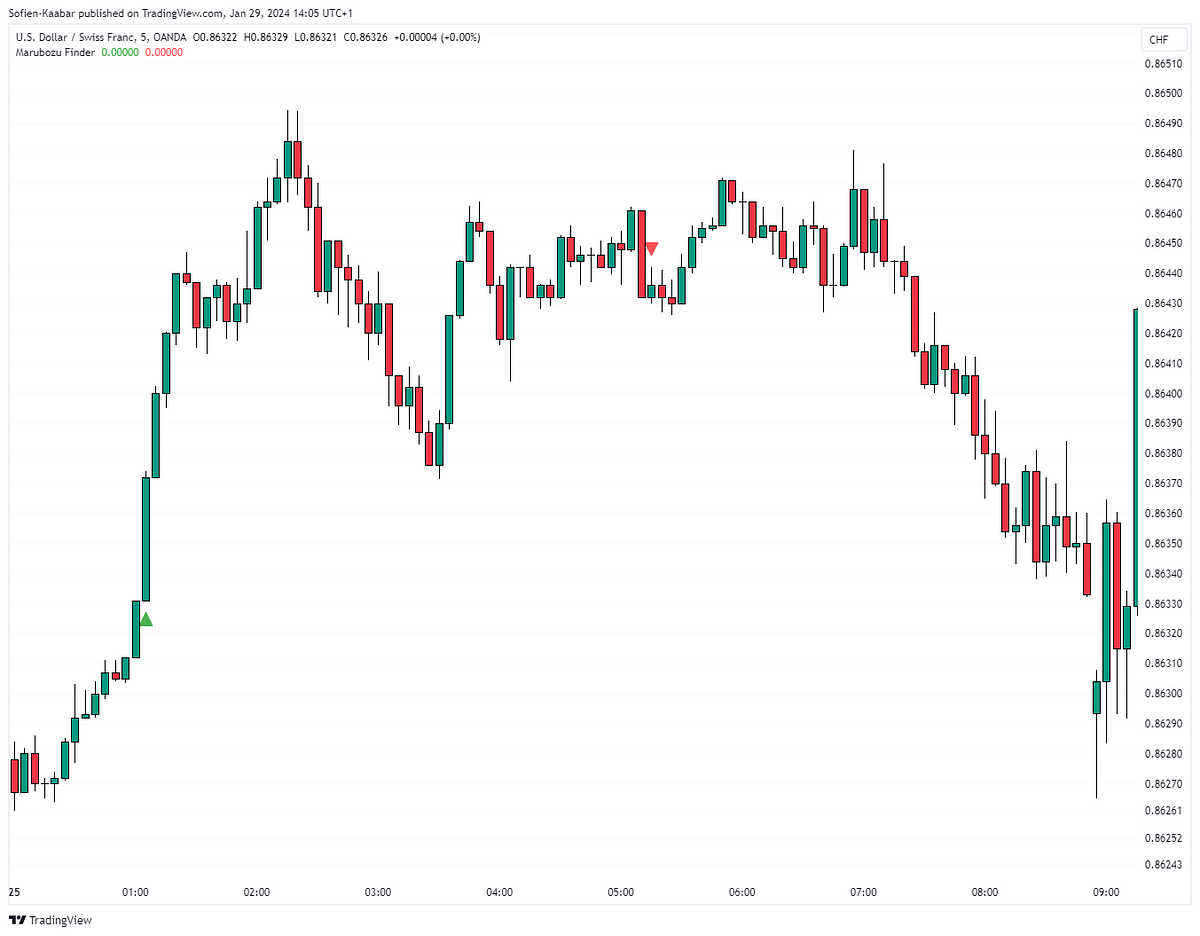
The following Figure shows a signal chart after the code has been applied and executed. Bear in mind that this pattern is quite rare.
The following Figure shows another signal chart.
The following Figure shows another signal chart.
You can also check out my other newsletter The Weekly Market Analysis Report that sends tactical directional views every weekend to highlight the important trading opportunities using technical analysis that stem from modern indicators. The newsletter is free.
If you liked this article, do not hesitate to like and comment, to further the discussion!


