


The Heiken-Ashi Indicator — Simplifying Trend-Following.
Creating the Famous Heiken-Ashi Indicator in Python.

Candlestick charts are the most common form of graphical analysis. They are an easy way to understand market psychology while having all the quantitative information needed for the market price. Another variation of candlesticks called Heikin-Ashi, seems to smooth the image so that the trending nature becomes clearer, however, Heikin-Ashi charts do not reflect actual prices as they are simple averages, therefore, to simplify things, we can create a Heikin-Ashi indicator.
I have just released a new book after the success of the previous book. It features advanced trend following indicators and strategies with a GitHub page dedicated to the continuously updated code. Also, this book features the original colors after having optimized for printing costs. If you feel that this interests you, feel free to visit the below Amazon link, or if you prefer to buy the PDF version, you could contact me on LinkedIn.
The Heikin-Ashi Method
Candlesticks are a quick way to understand OHLC data and detect patterns. It is very straightforward and easy to interpret. A bullish (typically green) candle is when the market closes above its opening price. A bearish (typically red) candle is when the market closes below its opening price.

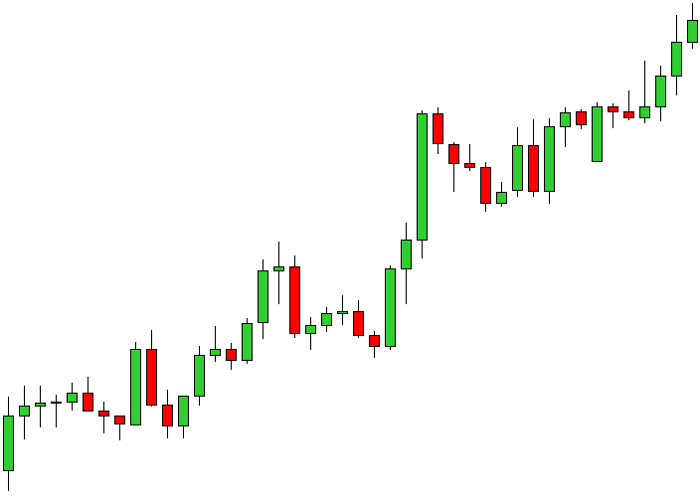
Let us see a full chart of candlestick to understand more how it is shown. The trend is clearly bullish with some corrections seen around the red candles. Notice the small candles where the opening price is almost the same as the closing price. This is called a Doji and signifies indecision and shows a possible reversal or consolidation.
Now, that we have seen what a candlestick chart is, we can proceed with the definition and coding of the Heiken-Ashi chart.
The Heiken-Ashi (Also called Heikin-Ashi) candlesticks seek to clean out the picture and show a clearer trend by smoothing out the OHLC data. Here is how to calculate the Heiken-Ashi candlesticks:

And to calculate the high and low price, we take the maximum and minimum prices of the following:

The above formulas will smooth out the candles to give us a more defined and clear trend.
To code a function in Python that adds 4 new columns containing OHLC Heiken-Ashi data, we can use the below code block:
def heiken_ashi(Data, opening, high, low, close, where):

    # Heiken-Ashi Open
    try:
        for i in range(len(Data)):
            Data[i, where] = (Data[i - 1, opening] + Data[i - 1, close]) / 2
    except:
        pass

    # Heiken-Ashi Close
    for i in range(len(Data)):
        Data[i, where + 3] = (Data[i, opening] + Data[i, high] + Data[i, low] + Data[i, close]) / 4

    # Heiken-Ashi High
    for i in range(len(Data)):
        Data[i, where + 1] = max(Data[i, where], Data[i, where + 3], Data[i, high])

    # Heiken-Ashi Low
    for i in range(len(Data)):
        Data[i, where + 2] = min(Data[i, where], Data[i, where + 3], Data[i, low])

    return Data
# To be used on an OHLC array with a few columns to spare
my_ohlc_array = heiken_ashi(my_ohlc_array, 0, 1, 2, 3, 4)# The numbers signify in order: Open, High, Low, Close, then the column indexed at 4 is where the first new Heiken OHLC data will be populated (Meaning that the columns 4, 5, 6, and 7 will have a brand new OHLC data)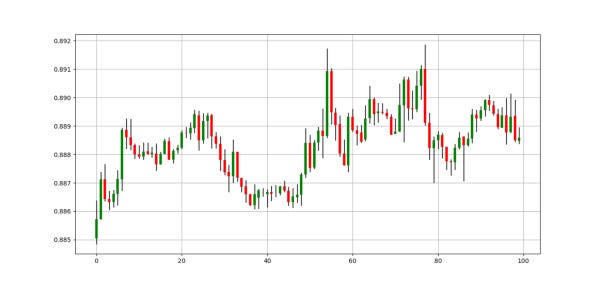

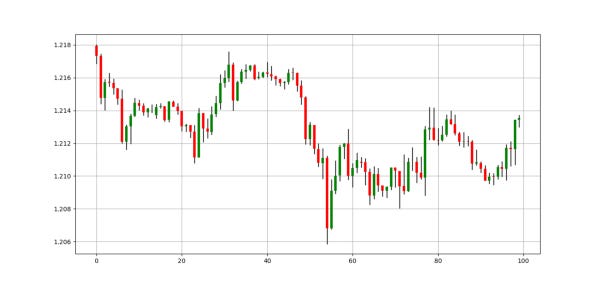
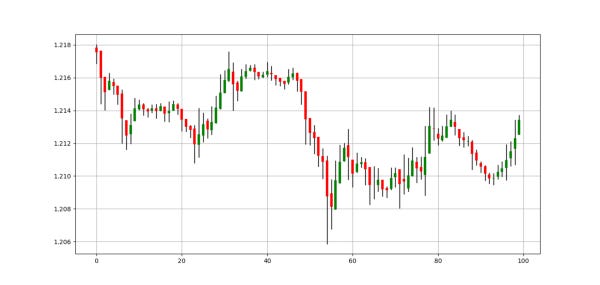
The two charts are simple a comparison between a regular candlestick chart and a Heiken-Ashi chart. We can see the resemblance but we can also see that the latter is smoother. We should note however that since the Heiken-Ashi method is simply an averaging, the price shown may not be the true market price.


The Heikin-Ashi Indicator
The indicator is simply a visual aid represented as an indicator so that we keep the original chart. This gives us the advantage of keeping the real prices in front of us. To create the indicator, we follow two simple rules:
Whenever the transformed closing price is greater than the transformed opening price, the Heikin-Ashi Indicator should show a value of 1.
Whenever the transformed closing price is less than the transformed opening price, the Heikin-Ashi Indicator should show a value of -1.

def adder(data, times):

    for i in range(1, times + 1):

        new = np.zeros((len(data), 1), dtype = float)

        data = np.append(data, new, axis = 1)
return datadef deleter(data, index, times):
for i in range(1, times + 1):
data = np.delete(data, index, axis = 1) return data
def jump(data, jump):
data = data[jump:, ]
return datadef heikin_ashi_indicator(Data, start, where):
Data = adder(Data, 1)
for i in range(len(Data)):
if (Data[i, start + 3] > Data[i, start]):
Data[i, where] = 1
elif (Data[i, start + 3] < Data[i, start]): Data[i, where] = -1
return Data
If you are also interested by more technical indicators and strategies, then my book might interest you:
One Last Word
I have recently started an NFT collection that aims to support different humanitarian and medical causes. The Society of Light is a set of limited collectibles which will help make the world slightly better as each sale will see a percentage of it sent directly to the charity attributed to the avatar. As I always say, nothing better than a bullet list to outline the benefits of buying these NFT’s:
High-potential gain: By concentrating the remaining sales proceedings on marketing and promoting The Society of Light, I am aiming to maximize their value as much as possible in the secondary market. Remember that trading in the secondary market also means that a portion of royalties will be donated to the same charity.
Art collection and portfolio diversification: Having a collection of avatars that symbolize good deeds is truly satisfying. Investing does not need to only have selfish needs even though there is nothing wrong with investing to make money. But what about investing to make money, help others, and collect art?
Donating to your preferred cause(s): This is a flexible way of allocating different funds to your charities.
A free copy of my book in PDF: Any buyer of any NFT will receive a free copy of my latest book shown in the link of the article.