The Harmonic Trading Strategy
Presenting a Discretionary Structured Trading Strategy
Trading strategies rarely rely on just one technique. Fundamental strategies may use a lot of financial ratios and cross-asset correlations to find opportunities, similarly, technical strategies may use multiple indicators and price action techniques to form one strategies which then is sprinkled with a touch of risk management to make it complete. This article discusses my main discretionary technical strategy which I have been using for years. The strategy is based on three elements, a Harmonic pattern, a moving average zone, and a standard RSI.
Harmonic Patterns
Harmonic Patterns are one of the powerful advanced price action techniques that are used to detect reactions. The thing that works about Harmonic Patterns is that they use the confluence method, meaning that they expect reactions from clusters of certain levels defined by Fibonacci retracements. The reason they work has nothing to do with mystic or magic whatsoever, it is simply the fact that Fibonacci retracements are used by many traders and their visibility makes reactions more likely, thus increasing the predictive power of the patterns.
However, only using Harmonic Patterns on their own might not be sufficient, they are best combined with contrarian indicators to increase the chances of a profitable trade. My preferred pattern is the 5–0, a complex structure with a better than average reactivity from price action.
The 5–0 pattern is simply a continuation of the Extreme Harmonic Impulse Wave pattern, hence, to understand it we must thoroughly comprehend the first pattern first, let’s do that.
The Extreme Harmonic Impulse Wave pattern is an interesting configuration that takes advantage of extended moves to detect an imminent reversal level. It is defined as:
The first leg should retrace back either 113.0% or 161.8%.
The second leg should retrace back either 161.8% or 224.0%
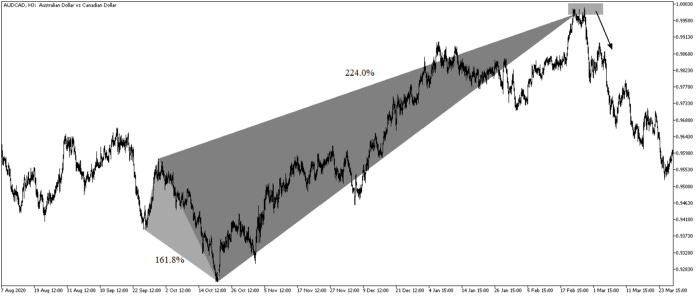
Here is another example of a bearish Extreme Harmonic Impulse Wave that has provided a reaction. Sometimes, harmonic patterns do provide reversals, but we are not supposed to expect that from them. They are merely used for reactions just unlike the one in the below chart.
The figure above shows a nice reaction after prices reached 224.0%. The Extreme Harmonic Impulse Wave pattern benefits from the time factor as extended moves are bound to correct sometime. It is not that easy to detect nor is it common but when it occurs, it definitely adds value to our trading.
The key retracements to watch out for are 161.8% and 224.0% which is simple the sum of the golden ratio and its reciprocal (61.8% + 161.8%). The conviction for the move around the 161.8% is good but better around 224.0% at the cost of missing out if we choose not to initiate the trade around 161.8%.
The Extreme Harmonic Impulse Wave Pattern can start to be detected after the reaction following the initial retracement. Therefore, we have enough time to act on it without any hindsight bias or delay. The below plots show how to detect one across time:
The first step above is detecting the initial wave that should be either 113.0% or 161.8% and then waiting for the reaction to the upside which should trend clearly. In the above plot, we can see two candidates for an initial level, both have retraced back 161.8%.
Now, we can even draw the pattern. All we need is the expected reaction from the C point defined as the 161.8% of the bigger pattern or the 224.0% of the smaller pattern which are coincidentally around the same zone.
Now that we have understood how to identify the Extreme Harmonic Impulse Wave, it is time to see how to trade the 5–0 which is a simple continuation of the pattern. The idea is that when we reach either 50.0% or 88.6% of the whole pattern’s retracement, the 5–0 pattern appears and signals a reversal or a consolidation.
Take the chart above as an example. When we retrace the whole move from B/B2 to C/C2, the 5–0 pattern requires us to buy whenever we retrace back 50.0%. Sometimes, the market breaks the support and continues going lower. With the 5–0 pattern, this is actually a conviction enhancer for a better level, the next retracement at 88.6%. What this means is that we can either wait for 88.6% to buy with a better conviction or be aggressive and buy at 50.0%.
Here is another example showing a bearish 5–0 configuration where we sell short at 50.0% (Aggressive).
And here is yet another example showing a bearish 5–0 configuration where we short sell at 88.6% (Conservative).
How do we know then when to initiate a position? 50.0% or 88.6%? Well, it depends on the below factors:
The readings on the technical indicators. Some indicators such as the RSI help us trade harmonic patterns. When we see that we are close to the 50.0% retracement level and the reading on the RSI is close to the extremes (Either oversold or overbought), we can have more faith that the pattern will work.
The risk appetite of the trader. We can be either opportunistic traders and try not to miss the trade in case it respects the 50.0% or we can be cautious traders and wait until the conviction is enhanced when the market price reaches the 88.6% retracement level.
Now, we will take a look at the second element in the strategy, the K’s Envelopes.
If you want to see more of my work, you can visit my website for the books catalogue by simply following this link:
The K’s Envelope
Trading can be about finding reactionary levels from where we assume prices will take a certain direction. And from that assumption, we initiate either a long (Buy) position or a short (Sell) position. Many techniques can be used to find support and resistance levels such as pivot points, Fibonacci retracements, and graphical levels. However, these techniques are all static in time, i.e. they do not move with real time data. In contrast, moving averages are dynamic and do a great job at finding support and resistance levels.
Moving averages help us confirm and ride the trend. They are the most known technical indicator and this is because of their simplicity and their proven track record of adding value to the analyses. We can use them to find support and resistance levels, stops and targets, and to understand the underlying trend. This versatility makes them an indispensable tool in our trading arsenal.
As the name suggests, this is your plain simple mean that is used everywhere in statistics and basically any other part in our lives. It is simply the total values of the observations divided by the number of observations. Mathematically speaking, it can be written down as:
I will admit it, this is the simplest indicator I have found and I cannot even say developed because it is simply two simple moving averages, one applied to the highs and one applied to the lows. The idea is to form support and resistance zones so that we find good entry points. The K’s Envelopes is the essence of most of my entry points.
The magic number here is 800. What does this mean? It is simply the lookback period I use for the K’s Envelopes. Let us see the below chart and interpret it.
The envelopes form a zone of dynamic support and resistance levels with the market. The hypothesis is that by whenever the market approaches the zone, a reversal bias is established while awaiting for the other two elements. Now, we can proceed to the third and last element in the trading strategy, the Relative Strength Index.
The Relative Strength Index
The RSI is without a doubt the most famous momentum indicator out there, and this is to be expected as it has many strengths especially in ranging markets. It is also bounded between 0 and 100 which makes it easier to interpret. Also, the fact that it is famous, contributes to its potential.
This is because the more traders and portfolio managers look at the RSI, the more people will react based on its signals and this in turn can push market prices. Of course, we cannot prove this idea, but it is intuitive as one of the basis of Technical Analysis is that it is self-fulfilling.
The RSI is calculated using a rather simple way. We first start by taking price differences of one period. This means that we have to subtract every closing price from the one before it. Then, we will calculate the smoothed average of the positive differences and divide it by the smoothed average of the negative differences. The last calculation gives us the Relative Strength which is then used in the RSI formula to be transformed into a measure between 0 and 100.
The most common strategy used on the RSI is where the trader is supposed to detect extremes in momentum that signal a reversal.
An oversold level is a threshold in the Relative Strength Index where the market is perceived to be oversold and ready for a bullish reaction. The idea is that too much selling has happened and the market should recover briefly.
An overbought level is a threshold in the Relative Strength Index where the market is perceived to be overbought and ready for a bearish reaction. The idea is that too much buying has happened and the market should pause briefly.
Make sure to focus on the concepts and not the code. You can find the codes of most of my strategies in my books. The most important thing is to comprehend the techniques and strategies.
The Strategy in Detail
The strategy is based on the confluence effect where multiple factors are impacting a move in order to give it more credit for a reaction. Therefore, the trading rules of the strategy are as follow:
A Buy (Long) signal is generated whenever the market is within the harmonic bullish reversal zone, close to the 800-period moving average support zone, and with a 13-period RSI close to 25%. We expect a reaction and then set our stops and targets according to volatility with a preference of short-term moves.
A Sell (Short) signal is generated whenever the market is within the harmonic bearish reversal zone, close to the 800-period moving average resistance zone, and with a 13-period RSI close to 75%. We expect a reaction and then set our stops and targets according to volatility with a preference of short-term moves.
The above chart shows a bullish configuration on the GBPUSD.
Sometimes, we can tolerate slight excesses but we need to be disciplined with the stops and target orders. It is not recommended to trade this strategy before economic releases.
Remember to always do your back-tests. You should always believe that other people are wrong. My indicators and style of trading may work for me but maybe not for you.
You can also check out my other newsletter The Weekly Market Sentiment Report that sends weekly directional views every weekend to highlight the important trading opportunities using a mix between sentiment analysis (COT report, put-call ratio, etc.) and rules-based technical analysis.
If you liked this article, do not hesitate to like and comment, to further the discussion!


