Gaps form an important part of price action. They vary in rareness from market to market. For instance, in the currencies market, they usually happen on opening following the weekend or whenever there is a big announcement while in stocks, gaps are fairly common from one day to another.
In this article, we will see the different types of gaps and then code a scanner in Python that finds them and applies the well-known practice of “filling the gaps”. From that we can evaluate the fill ratio of the gap.
If you are interested by trend following indicators and strategies then my book could interest you. It features advanced trend-following indicators and strategies with a GitHub page dedicated to the continuously updated code. Also, this book features the original colors after having optimized for printing costs. If you feel that this interests you, feel free to visit the below Amazon link, or if you prefer to buy the PDF version, you could contact me on LinkedIn.
Trend Following Strategies in Python: How to Use Indicators to Follow the Trend.
Amazon.com: Trend Following Strategies in Python: How to Use Indicators to Follow the Trend.: 9798756939620: Kaabar…www.amazon.com
Introduction to Gaps
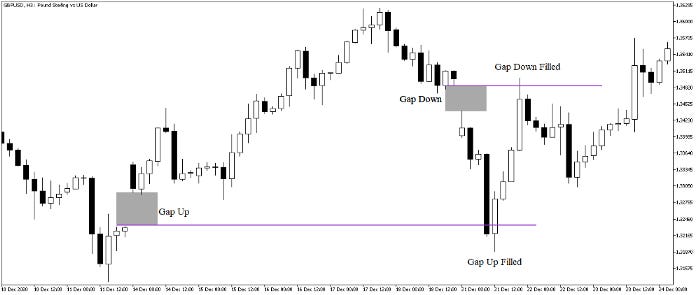
A gap is a discontinuation or a hole between prices. When a market is trading at $100 and suddenly trades at $102 without ever quoting at $101, it has formed a gap. This can be seen in the charts where it appears to have a missing piece between candlesticks. Take a look at the below chart on the GBPUSD and notice the empty space in grey between candlesticks.
Gaps can occur due to fundamental and technical reasons, but we are mostly interested in identifying and trading them. In the currencies market, the visible gaps are the ones that occur during the weekend. Since it is traded all day long for 5 days a week, the presumed gaps would probably look like giant candles, but since we cannot know for sure, we will stick to the common definition of gaps.
“We call the act of trading based on gaps: Playing the gap.”
There are different types of gaps and distinguishing them can be quite tricky:
A common gap: It generally occurs in a sideways markets. It is likely to be filled because of the market’s mean-reversion dynamic.
A breakaway gap: It generally resembles a common gap but the gap occurs above a graphical resistance or below a graphical support. It signals acceleration in the new trend.
A runaway gap: It generally occurs within the trend but it confirms it more, therefore, it is a continuation pattern.
An exhaustion gap: It generally occurs at the end of a trend and close to a support or resistance level. It is a reversal pattern.
Note that most of the above specificities come from personal experience as some sources state that common gaps are least likely to be filled. Also, the runaway and exhaustion gaps are so similar that it is almost impossible to know which is which at the moment they appear, therefore, they suffer from hindsight bias.
The above chart shows a chart on GBPUSD with a breakaway gap after a triple bottom bullish reversal pattern following the surpass of its resistance. This gives credit that the move will likely continue higher.
In this article, we will be considering that all gaps should be filled and therefore, all gaps encountered by the algorithm coded below are common gaps. Many explanations can be used to explain why gaps are filled:
An overly optimistic or pessimistic gap reaction which makes participants go in the other direction to fade this gap. This is also called Irrational Exuberance, a term first coined by Alan Greenspan.
The gap occurs around a support or resistance level forcing it to reverse course.
Creating the Strategy
Just as we detect common gaps with our eyes, we can code a recursive algorithm that does the same thing for us. What variables can we use to populate the scanner function? I would say the width variable is the most important one.
The width: This is your threshold where you would say for certain that there is a gap. On hourly FX data, we cannot really say that 1 or 2 pips are worthy of a gap. Therefore, we can consider that at least a 5 pips gap is worthy of being traded. Taking into account a 0.2 spread, an example of maximum profit on EURUSD would be 5–0.2 = 4.8 pips which is $4.8 on a mini lot account with 1:100 leverage. I say maximum profit because our target on the gap trade is to fill it. This means that if the gap is 5 pips wide, and we trade directly based on it, we can expect 4.8 pips gain after accounting for the spread. Let us take a look at the scanner function below:
width = 0.0005 # 5 pips Gap example for Hourly OHLC datadef signal(Data, opening, close, width, buy, sell):
for i in range(len(Data)):
if Data[i, opening] < Data[i - 1, close] and abs(Data[i, opening] - Data[i - 1, close]) >= width:
Data[i, buy] = 1
if Data[i, opening] > Data[i - 1, close] and abs(Data[i, opening] - Data[i - 1, close]) >= width:
Data[i, sell] = -1
return DataThe signal function takes into account 4 variables:
The Data variable is the OHLC time series in the form of an array, preferably a numpy array.
The closing variable is the column that holds the closing price (The C in OHLC).
The opening variable is the column that holds the opening price (The O in OHLC).
The width is the distance between the closing price and the new opening price that has just opened. This measures the minimum distance for the gap to be considered worthy for a trade.
The buy and sell variables are the columns where the buy and sell orders are put. A value of 1 refers to a buying trigger while a value of -1 refers to a selling trigger.
It is time to back-test the strategy for informational purposes and to see where does pure gap trading stands with regards to predictability. The trading rules are therefore:
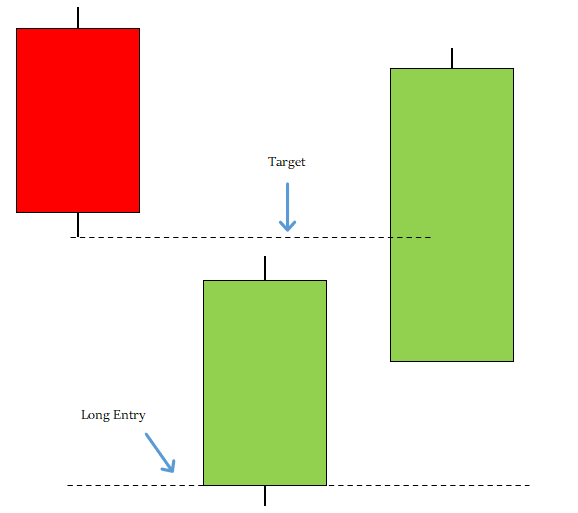
A long (Buy) signal is generated whenever the scanner identifies a bullish gap configuration. A bullish gap is a gap down looking to be filled upwards when the market’s high reaches the low of the candle before the gap. Therefore, the signal is triggered at the open price.
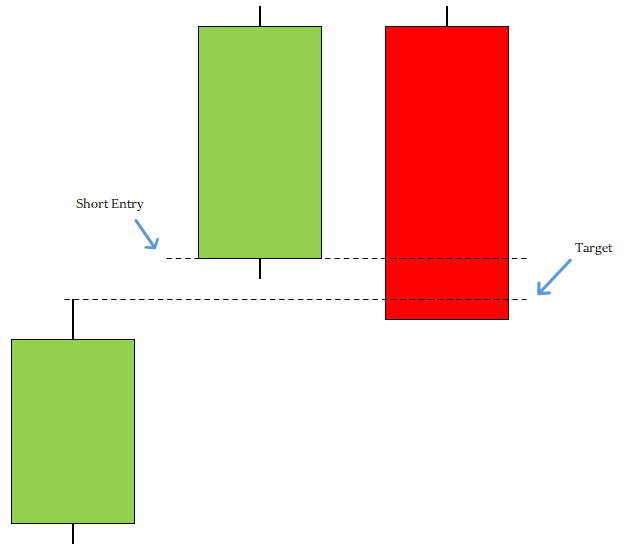
Go short (Sell) whenever the scanner identifies a bearish gap configuration. A bearish gap is a gap up looking to be filled downwards when the market’s low reaches the high of the candle before the gap. Therefore, the signal is triggered at the open price.
The trade is opened and closed either at fill or stopped at the next signal.
The above illustration shows an example of a gap that needs to be filled through a short sell trade, therefore, we will sell at the opening above the previous closing price and target its high.
The above illustration shows an example of a gap that needs to be filled through a long trade, therefore, we will buy at the opening below the previous closing price and target its low.
def quality(Data, buy, sell, where):

    for i in range(len(Data)):

        try:

            if Data[i, buy] == 1:

                for a in range(i, len(Data)):

                    if Data[a, 1] >= Data[i - 1, 2]:

                        Data[a, where] = Data[i - 1, 2] - Data[i, 0]
                        break

                    elif Data[a, sell] == -1:

                        Data[a, where] = Data[a, 0] - Data[i, 0]
                        break

            elif Data[i, sell] == -1:

                for a in range(i, len(Data)):

                    if Data[a, 2] <= Data[i - 1, 1]:

                        Data[a, where] = Data[i, 0] - Data[i - 1, 1]
                        break

                    elif Data[a, buy] == 1:

                        Data[a, where] = Data[i, 0] - Data[a, 0]
                        break

        except IndexError:

             pass

    return Data
my_data = quality(my_data, 6, 7, 8)total_net_profits = my_data[my_data[:, 8] > 0, 8]
total_net_losses = my_data[my_data[:, 8] < 0, 8]
total_net_losses = abs(total_net_losses)fill_ratio = len(total_net_profits) / (len(total_net_losses) + len(total_net_profits))
fill_ratio = round(fill_ratio, 2) * 100The fill ratio measures the percentage of gaps that have been filled before the market encounters another gap. The rationale is very simple:
If we encounter a down gap which gives us a bullish signal, we will wait until it is filled or another gap is encountered which in case we consider the first gap unfilled.
If we encounter an up gap which gives us a bearish signal, we will wait until it is filled or another gap is encountered which in case we consider the first gap unfilled.
The below are a sample of the results on hourly data:
# EURUSD Fill Ratio: 78.00%
# EURGBP Fill Ratio: 81.00%
# The fill ratio is saying that whenever we encounter any type of gap on the EURUSD and EURGBP, we have a probability of 78% and 81% of seeing it filled.If you want to see how to create all sorts of algorithms yourself, feel free to check out Lumiwealth. From algorithmic trading to blockchain and machine learning, they have hands-on detailed courses that I highly recommend.
Learn Algorithmic Trading with Python Lumiwealth
Learn how to create your own trading algorithms for stocks, options, crypto and more from the experts at Lumiwealth. Click to learn more
Summary
To sum up, what I am trying to do is to simply contribute to the world of objective technical analysis which is promoting more transparent techniques and strategies that need to be back-tested before being implemented. This way, technical analysis will get rid of the bad reputation of being subjective and scientifically unfounded.
I recommend you always follow the the below steps whenever you come across a trading technique or strategy:
Have a critical mindset and get rid of any emotions.
Back-test it using real life simulation and conditions.
If you find potential, try optimizing it and running a forward test.
Always include transaction costs and any slippage simulation in your tests.
Always include risk management and position sizing in your tests.
Finally, even after making sure of the above, stay careful and monitor the strategy because market dynamics may shift and make the strategy unprofitable.


