
The Fibonacci Moving Average - Revisited
Include the Fibonacci Moving Average in Your Trading


The Fibonacci moving average is a type of moving average that uses the Fibonacci sequence as a lookback period and aims to provide a strong support and resistance zone. This article presents this indicator and shows how to code it.
Moving Averages in a Nutshell
A moving average is one of the most foundational indicators in all of technical analysis. At its core, it's a smoothing mechanism: a way to filter out short-term fluctuations in price to reveal a more persistent, underlying trend.
Traders use moving averages to define trend direction, generate trading signals, and smooth noisy data for further indicator development.
The idea is simple: instead of reacting to every up-and-down tick, we take a running average of past prices, shifting the window forward by one bar each time — hence the word moving.
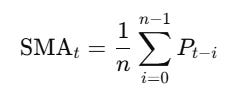
Where:
P is the price (usually close) at time t.
n is the window or period (e.g. 20-day).
The SMA gives equal weight to every value in the window. This makes it smooth, but slow to react — particularly in volatile or fast-changing markets.
Do you want to master Deep Learning techniques tailored for time series, trading, and market analysis🔥? My book breaks it all down from basic machine learning to complex multi-period LSTM forecasting while going through concepts such as fractional differentiation and forecasting thresholds. Get your copy here 📖!
The Fibonacci Moving Average
The concep is simple, we want to create a moving average that relates to the Fibonacci sequence. Here’s how:
We will calculate 15 exponential moving averages, each having one of the following lookback periods {2, 3, 5, 8, 13, 21, 34, 55, 89, 144, 233, 377, 610, 987, 1597}.
The above calculation are to be done on the highs and on the lows.
For each time step take the simple average of the 15 EMAs for both highs and lows, thus creating a rolling zone of an average of 15 exponential moving averages.
The following chart shows the FMA in action.

Use the following code in Pine Script to create the indicator.
//@version=4

study("K's Fibonacci Moving Average", overlay = true)

hfib_ma_2    = ema(high, 2)
hfib_ma_3    = ema(high, 3)
hfib_ma_5    = ema(high, 5)
hfib_ma_8    = ema(high, 8)
hfib_ma_13   = ema(high, 13)
hfib_ma_21   = ema(high, 21)
hfib_ma_34   = ema(high, 34)
hfib_ma_55   = ema(high, 55)
hfib_ma_89   = ema(high, 89)
hfib_ma_144  = ema(high, 144)
hfib_ma_233  = ema(high, 233)
hfib_ma_377  = ema(high, 377)
hfib_ma_610  = ema(high, 610)
hfib_ma_987  = ema(high, 987)
hfib_ma_1597 = ema(high, 1597)

fib_high = (hfib_ma_5 + hfib_ma_8 + hfib_ma_13 + hfib_ma_21 + hfib_ma_34 + hfib_ma_55 + hfib_ma_89 + hfib_ma_144 + hfib_ma_233 + hfib_ma_377 + hfib_ma_610 + hfib_ma_987 + hfib_ma_1597 + hfib_ma_2 + hfib_ma_3) / 15

lfib_ma_2    = ema(low, 2)
lfib_ma_3    = ema(low, 3)
lfib_ma_5    = ema(low, 5)
lfib_ma_8    = ema(low, 8)
lfib_ma_13   = ema(low, 13)
lfib_ma_21   = ema(low, 21)
lfib_ma_34   = ema(low, 34)
lfib_ma_55   = ema(low, 55)
lfib_ma_89   = ema(low, 89)
lfib_ma_144  = ema(low, 144)
lfib_ma_233  = ema(low, 233)
lfib_ma_377  = ema(low, 377)
lfib_ma_610  = ema(low, 610)
lfib_ma_987  = ema(low, 987)
lfib_ma_1597 = ema(low, 1597)

fib_low = (lfib_ma_5 + lfib_ma_8 + lfib_ma_13 + lfib_ma_21 + lfib_ma_34 + lfib_ma_55 + lfib_ma_89 + lfib_ma_144 + lfib_ma_233 + lfib_ma_377 + lfib_ma_610 + lfib_ma_987 + lfib_ma_1597 + lfib_ma_2 + lfib_ma_3) / 15

plot(fib_high, color = color.black)
plot(fib_low, color = color.black)
The zones form strong support and resistance during trending markets.

You can form trading strategies based on dynamic support and resistance levels of the FMA. For example, every time the price is inside the zone with an RSI below 50, it’s a buy opportunity. In contrast, whenever the price is inside the zone with an RSI above 50, it’s a sell opportunity.

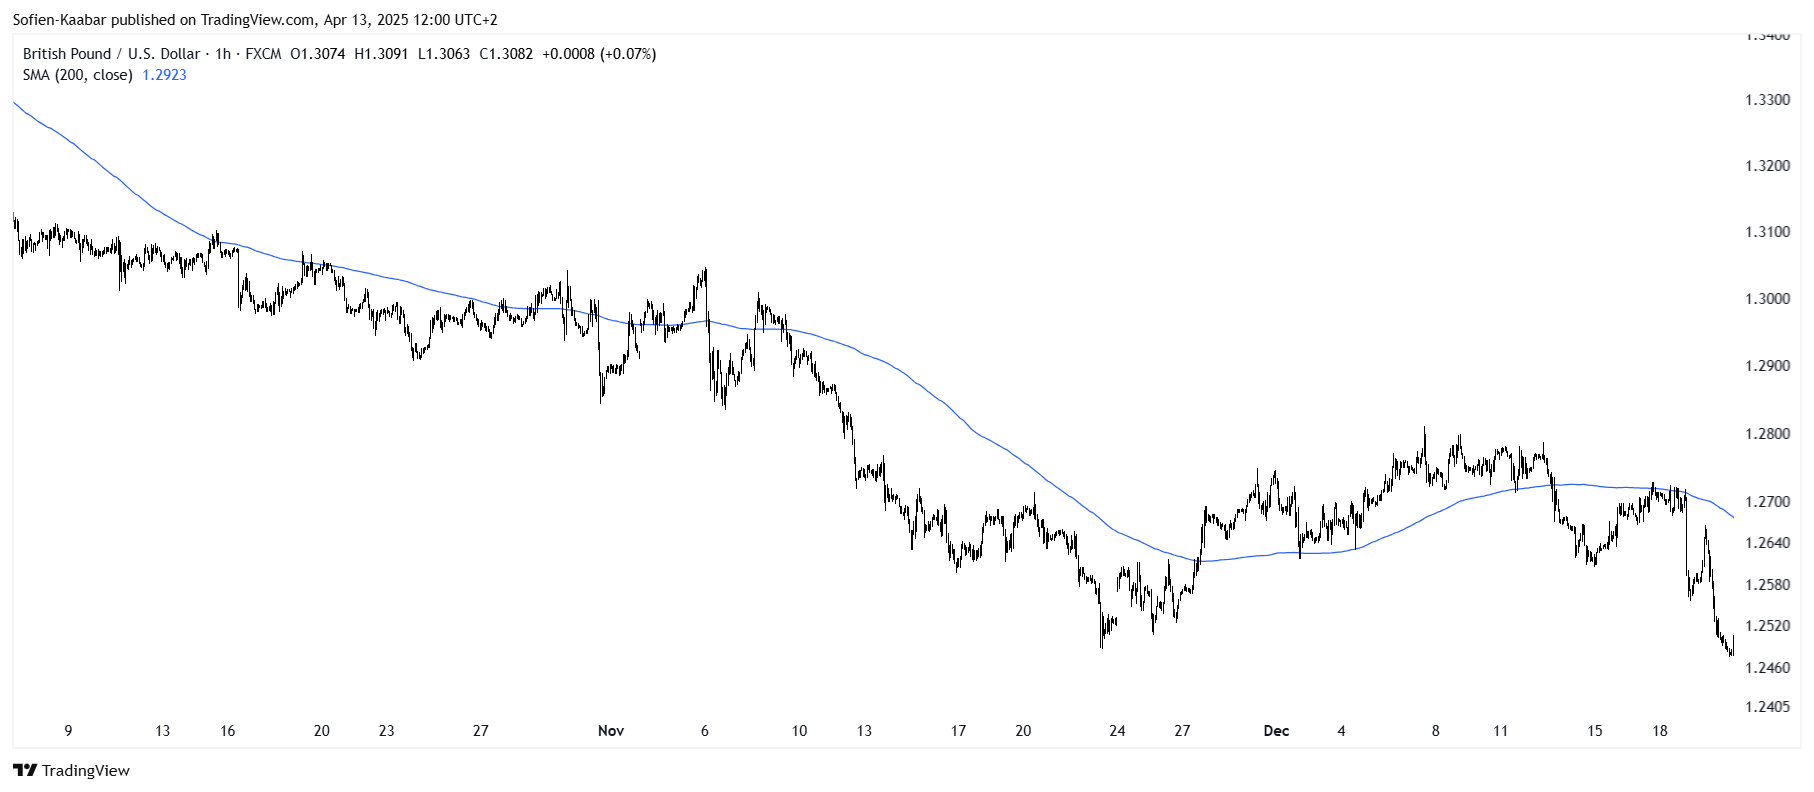
The FMA cannot be used to detect a switch in the trend as it’s not made for that. The lag is important that it makes it impossible to be an interesting trend detector. Take a look at the following chart. Notice how the market dips below the moving average way after it has started dropping. However, the zones do act as valid support and resistances.

Every week, I analyze positioning, sentiment, and market structure. Curious what hedge funds, retail, and smart money are doing each week? Then join hundreds of readers here in the Weekly Market Sentiment Report 📜 and stay ahead of the game through chart forecasts, sentiment analysis, volatility diagnosis, and seasonality charts.
Free trial available🆓
