


Contrarian indicators come in different shapes and colors. The detrended price oscillator is one famous color that aims to capture peaks and troughs through market cycle concepts. In this article, we will create the indicator from scratch.
I have released a new book after the success of my previous one “Trend Following Strategies in Python”. It features advanced contrarian indicators and strategies with a GitHub page dedicated to the continuously updated code. If you feel that this interests you, feel free to visit the below Amazon link (which contains a sample), or if you prefer to buy the PDF version, you could check the link at the end of the article.
Contrarian Trading Strategies in Python
Amazon.com: Contrarian Trading Strategies in Python: 9798434008075: Kaabar, Sofien: Bookswww.amazon.com
The Concept of Moving Averages
Moving averages come in all shapes and types. The most basic type is the simple moving average which is simply the sum divided by the quantity. The next mathematical representation shows how to calculate a simple mean given a dataset:

Therefore, the simple moving average is the sum of the values divided by their number. In technical analysis, you generally use moving averages to understand the underlying trend and to find trading signals.
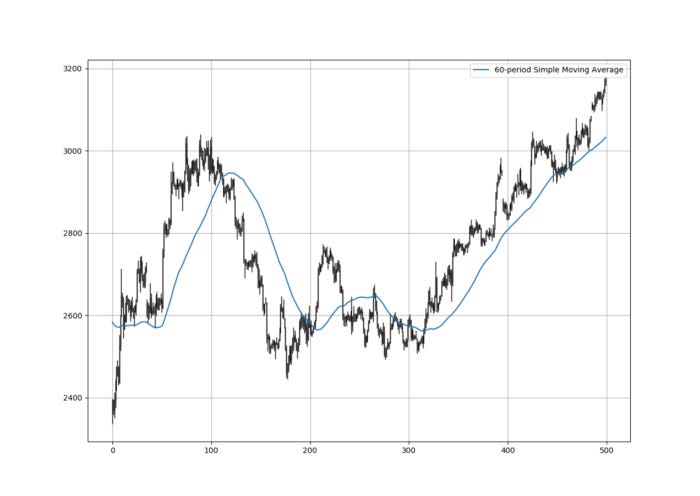
Check the next Figure which shows a 60-period simple moving average applied on hourly values of Ethereum versus USD.
If you are also interested by trend following strategies and indicators, then my previous book might interest you:
Trend Following Strategies in Python: How to Use Indicators to Follow the Trend.
Amazon.com: Trend Following Strategies in Python: How to Use Indicators to Follow the Trend.: 9798756939620: Kaabar…www.amazon.com
Creating the Detrended Price Oscillator
The detrended price oscillator — DPO is a price transformation that uses the price from a certain period ago in relation to the current moving average. It is a contrarian indicator that aims to remove the trend in order to have a better vision on troughs and peaks.

The way to calculate the indicator is by selecting a lookback period, in our example, it will be 8. The first step is to calculate an 8-period simple moving average on the price. Then, we need to calculate the variable k which is simply the lookback period divided by two and then we add 1. Therefore, with a lookback period of 8, the k variable equals 5. The last step is to subtract the closing price k periods ago from the current 8-period moving average.


Testing a Simple Strategy
As with any proper research method, the aim is to back-test the indicator and to be able to see for ourselves whether it is worth having as an add-on to our pre-existing trading framework. It is possible that this is not the optimal time frame for the strategy, but we are just trying to find a one-shoe-size-almost-fits-all strategy. The conditions are:
Go long (Buy) whenever the Adaptive Strength reaches -0.001 with the previous two values above -0.001. Hold this position until getting another signal or getting stopped by the risk management system.
Go short (Sell) whenever the Adaptive Strength reaches 0.001 with the previous two values below 0.001. Hold this position until getting another signal or getting stopped by the risk management system.


Summary
To summarize up, what I am trying to do is to simply contribute to the world of objective technical analysis which is promoting more transparent techniques and strategies that need to be back-tested before being implemented. This way, technical analysis will get rid of the bad reputation of being a subjective and scientifically unfounded.
I recommend you always follow the the below steps whenever you come across a trading technique or strategy:
Have a critical mindset and get rid of any emotions.
Back-test it using real life simulation and conditions.
If you find potential, try optimizing it and running a forward test.
Always include transaction costs and any slippage simulation in your tests.
Always include risk management and position sizing in your tests.
Finally, even after making sure of the above, stay careful and monitor the strategy because market dynamics may shift and make the strategy unprofitable.
For the PDF alternative, the price of the book is 9.99 EUR. Please include your email in the note before paying so that you receive it on the right address. Also, once you receive it, make sure to download it through google drive.
Pay Kaabar using PayPal.Me
If you accept cookies, we’ll use them to improve and customize your experience and enable our partners to show you…www.paypal.com