The Deep Reversal Indicator as a Powerful Market Predictor
Using The Deep Duration Technique For Market Predictions
Market reversals can sometimes be predicted by a few techniques when conditions are normal. This article presents a reversal technique referred to as the deep duration technique.
The Concept of Extreme and Deep Duration
First introduced by J. Welles Wilder Jr., the RSI is one of the most popular and versatile technical indicators. Mainly used as a contrarian indicator where extreme values signal a reaction that can be exploited. Typically, we use the following steps to calculate the default RSI:
Calculate the change in the closing prices from the previous ones.
Separate the positive net changes from the negative net changes.
Calculate a smoothed moving average on the positive net changes and on the absolute values of the negative net changes.
Divide the smoothed positive changes by the smoothed negative changes. We will refer to this calculation as the Relative Strength — RS.
Apply the normalization formula shown below for every time step to get the RSI.
I have presented the RSI first because the extreme duration is simply an add-on to any bounded indicator. It is not an indicator on its own per se, but simply a way to see how long the indicator spends being overbought or oversold. We understand that:
An overbought indicator is saying that the bullish momentum should fade soon and we might see a correction or even a reversal on the downside.
An oversold indicator is saying that the bearish momentum should fade soon and we might see a correction or even a reversal on the upside.
However, if things were so simple, we would all be millionaires. This is why we need other techniques to improve our forecasting ability. One of these techniques answers the following question:
“What if the average time spent on the extremes can help us understand when the indicator will exit these mentioned extremes?”
Let’s create those conditions then:
A bullish signal is generated whenever the current low is lower than the previous open while the previous 8-period RSI is lower than 50 but higher than 35. Additionally, the 4 RSI’s before it must be below 35.
A bearish signal is generated whenever the current high is higher than the previous open while the previous 8-period RSI is higher than 50 but lower than 65. Additionally, the 4 RSI’s before it must be above 65.
✨ Important note
Extreme duration is therefore a timing technique by which we calculate a minimum time that an indicator spends in the overbought or oversold zone. The exit of such zones generates the signal.
The following chart shows an example of a few signals generated by the extreme duration techique:
If you want to see more of my work, you can visit my website for the books’ catalogue by simply following the link attached the picture.
Applying the Deep Duration Technique
Similar to the extreme duration technique, the deep duration technique applies more conditions in order to filter out false signals. The conditions of the deep duration technique are as follows:
A bullish signal is generated whenever the current low is lower than the previous open while the previous 8-period RSI is lower than 50 but higher than 35. Additionally, the 12 RSI’s before it must be below 35.
A bearish signal is generated whenever the current high is higher than the previous open while the previous 8-period RSI is higher than 50 but lower than 65. Additionally, the 12 RSI’s before it must be above 65.
✨ Important note
The observation number of the values of the RSI is 5 with the extreme duration technique and 13 with the deep duration technique. Both are Fibonacci numbers.
Use the following code in Pine Script (TradingView) to create and visualize the technique:
// This source code is subject to the terms of the Mozilla Public License 2.0 at https://mozilla.org/MPL/2.0/
// © Sofien-Kaabar

//@version=5
indicator('K`s Deep Duration', overlay = true)

upper_barrier = input(defval = 65, title = 'Upper Barrier')
lower_barrier = input(defval = 35, title = 'Lower Barrier')
length = input(defval = 8, title = 'Lookback')

rsi = ta.rsi(close, length)

buy  = low  < open[1] and rsi[1]  < 50 and rsi[1] > lower_barrier  and rsi[2] < lower_barrier and rsi[3] < lower_barrier and rsi[4] < lower_barrier and rsi[5] < lower_barrier and rsi[6] < lower_barrier and rsi[7] < lower_barrier and rsi[8] < lower_barrier and rsi[9] < lower_barrier and rsi[10] < lower_barrier and rsi[11] < lower_barrier and rsi[12] < lower_barrier and rsi[13] < lower_barrier
sell = high > open[1] and rsi[1]  > 50 and rsi[1] < upper_barrier  and rsi[2] > upper_barrier and rsi[3] > upper_barrier and rsi[4] > upper_barrier and rsi[5] > upper_barrier and rsi[6] > upper_barrier and rsi[7] > upper_barrier and rsi[8] > upper_barrier and rsi[9] > upper_barrier and rsi[10] > upper_barrier and rsi[11] > upper_barrier and rsi[12] > upper_barrier and rsi[13] > upper_barrier

plotshape(buy,  style = shape.triangleup, color = color.green, location =  location.belowbar, size = size.small)
plotshape(sell,  style = shape.triangledown, color = color.red, location =  location.abovebar, size = size.small)
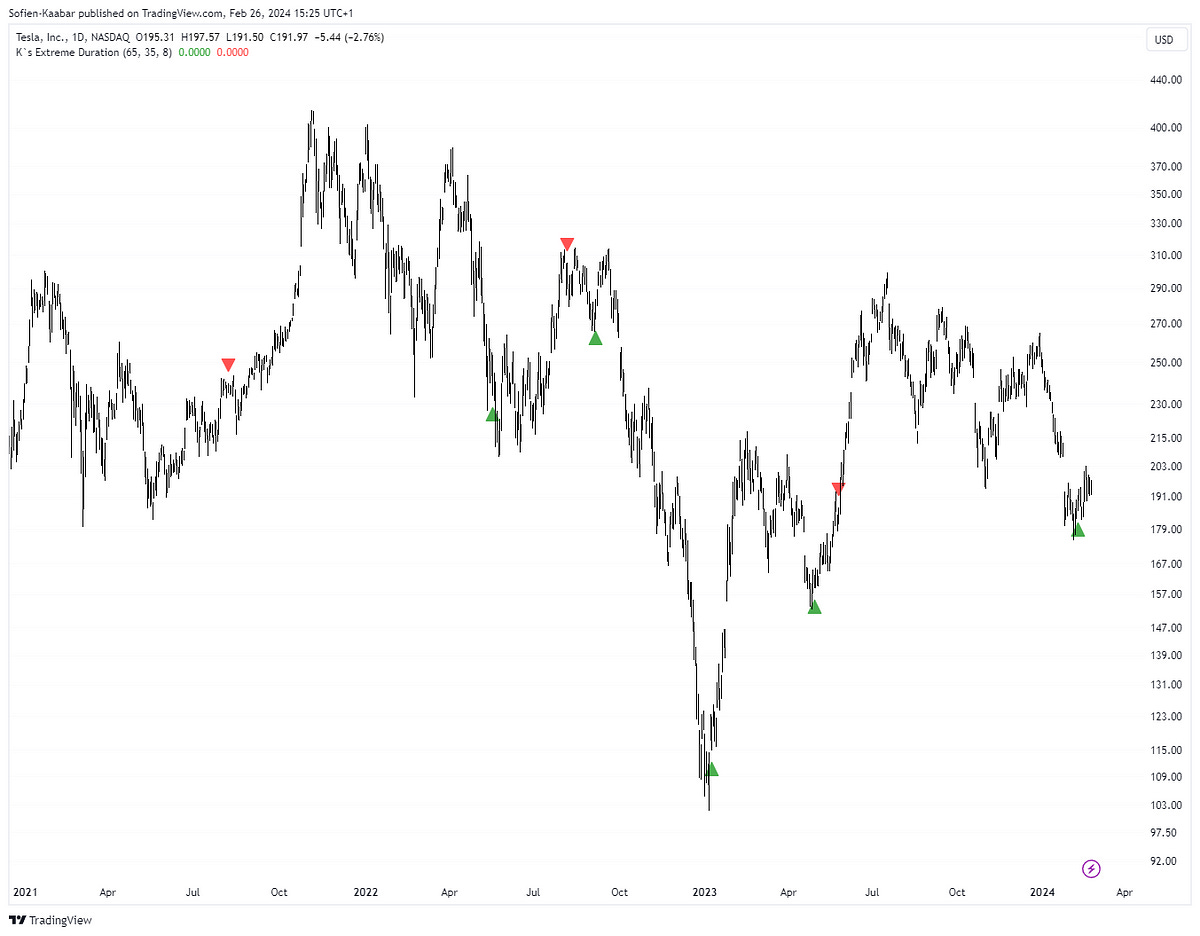
The following chart shows a few signals generated from the deep duration technique:
The following chart shows more signals generated from the deep duration technique:
The technique does not work all the time, naturally. Trending markets are its worst enemy. When the fundamentals and the smart money are supporting the trend, nothing can stand in its way. Take a look at Tesla’s bullish phase:
A lot of optimization can be done on this promising technique, especially that only value-wise readings are not sufficient anymore. Temporal analysis is paramount to better understand how the underlying reacts.
You can also check out my other newsletter The Weekly Market Sentiment Report that sends tactical directional views every weekend to highlight the important trading opportunities using a mix between sentiment analysis (COT reports, Put-Call ratio, Gamma exposure index, etc.) and technical analysis.


