The Correlation-Adjusted Reversal Indicator.
Creating a Correlation-Adjusted Mean-Reversion Indicator in Python.
Combining statistical metrics with technical indicators is a powerful tool that allows us to take advantage of more market properties. In this article, we will try to combine mean-reversion through a simple differencing with the linear correlation metric and how it performs when used in a normal contrarian trading strategy.
I have just released a new book after the success of the previous book. It features advanced trend following indicators and strategies with a GitHub page dedicated to the continuously updated code. Also, this book features the original colors after having optimized for printing costs. If you feel that this interests you, feel free to visit the below Amazon link, or if you prefer to buy the PDF version, you could contact me on LinkedIn.
Introduction to the Concept of Correlation
Correlation is the degree of linear relationship between two or more variables. It is bounded between -1 and 1 with one being a perfectly positive correlation, -1 being a perfectly negative correlation, and 0 as an indication of no linear relationship between the variables (they relatively go in random directions). The measure is not perfect and can be biased by outliers and non-linear relationships, it does however provide quick glances to statistical properties.
Before coding the function, we need the following three primal functions that allow us to manipulate the data easily:
def adder(data, times):

    for i in range(1, times + 1):

        new = np.zeros((len(data), 1), dtype = float)

        data = np.append(data, new, axis = 1)
return datadef deleter(data, index, times):
for i in range(1, times + 1):
data = np.delete(data, index, axis = 1) return data
def jump(data, jump):
data = data[jump:, ]
return data
We can code the correlation function between two variables in Python using the below. Note that it has to be an array and not a data frame:
def rolling_correlation(Data, first_data, second_data, lookback, where):

    for i in range(len(Data)):

        try:
            Data[i, where] = pearsonr(Data[i - lookback + 1:i + 1, first_data], Data[i - lookback + 1:i + 1, second_data])[0]


        except ValueError:
            pass

    Data = jump(Data, lookback)

return DataCreating the Correlation-Adjusted Reversal Indicator
The idea for the correlation-adjusted reversal indicator is to detect average extremes where the correlation between returns and prices is high enough to justify a possible market inflection. The steps required to calculate the indicator are as follows:
Calculate the difference between the current price and the price 1 period ago.
Calculate the difference between the current price and the price 2 periods ago.
Calculate the difference between the current price and the price 3 periods ago.
Calculate the difference between the current price and the price 4 periods ago.
Calculate the difference between the current price and the price 5 periods ago.
Calculate the difference between the current price and the price 6 periods ago.
Calculate the average of all the calculations above for each row.
Calculate the 10-period correlation between the price and the average from the previous step.
Select a threshold such as 0.75. Then, loop around the data with a condition that if the correlation is greater than 0.75, keep the current average, otherwise, input zero as the average.
The full code of the indicator can be found as below, considering an OHLC data array.
def correlation_adjusted_reversal_indicator(Data, lookback, close, where, threshold = 0.75):

    # Adding a few columns
    Data = adder(Data, 8)

    # Average of current close minus the previous period
    for i in range(len(Data)):

        Data[i, where] = Data[i, close] - Data[i - 1, close]
# Average of current close minus n then
for i in range(len(Data)):
Data[i, where + 1] = Data[i, close] - Data[i - 2, close] # Average of current close minus the close 2 periods ago
for i in range(len(Data)):
Data[i, where + 2] = Data[i, close] - Data[i - 3, close] # Average of current close minus the close 3 periods ago
for i in range(len(Data)):
Data[i, where + 3] = Data[i, close] - Data[i - 4, close] # Average of current close minus close 4 periods ago
for i in range(len(Data)):
Data[i, where + 4] = Data[i, close] - Data[i - 5, close] # Average of current close minus close 5 periods ago
for i in range(len(Data)):
Data[i, where + 5] = Data[i, close] - Data[i - 6, close] # Calculating the average mean-reversion
Data[:, where + 6] = (Data[:, where] + Data[:, where + 1] + Data[:, where + 2] + Data[:, where + 3] + Data[:, where + 4] + Data[:, where + 5]) / 6
# Cleaning
Data = deleter(Data, where, 6)
# Adjusting for correlation
Data = rolling_correlation(Data, close, where, lookback, where + 1)
for i in range(len(Data)):
if Data[i, where + 1] > threshold:
Data[i, where] = Data[i, where]
elif Data[i, where + 1] < threshold:
Data[i, where] = 0
# Cleaning
Data = deleter(Data, where + 1, 1)
return Data# Calling the function
my_data = correlation_adjusted_reversal_indicator(my_data, 10, 3, 4)If you are also interested by more technical indicators and strategies, then my book might interest you:
Using the Indicator
As with any proper research method, the aim is to test the indicator and to be able to see for ourselves whether it is worth having as an add-on to our pre-existing trading framework. The conditions for the back-test are as follows:
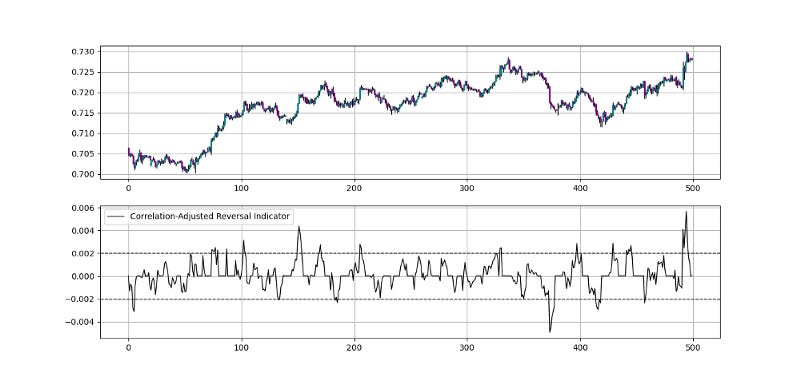
Long (Buy) whenever the CARI reaches -0.002 with the two previous readings above -0.002.
Short (Sell) whenever the CARI reaches 0.002 with the two previous readings below 0.002.
def signal(Data, what, buy, sell):

    Data = adder(Data, 10)
    Data = rounding(Data, 5)

    for i in range(len(Data)):

        if Data[i, what] < lower_barrier and Data[i - 1, what] > lower_barrier and Data[i - 2, what] > lower_barrier :
            Data[i, buy] = 1

        if Data[i, what] > upper_barrier and Data[i - 1, what] < upper_barrier and Data[i - 2, what] < upper_barrier :
            Data[i, sell] = -1

return DataOne Last Word
I have recently started an NFT collection that aims to support different humanitarian and medical causes. The Society of Light is a set of limited collectibles which will help make the world slightly better as each sale will see a percentage of it sent directly to the charity attributed to the avatar. As I always say, nothing better than a bullet list to outline the benefits of buying these NFT’s:
High-potential gain: By concentrating the remaining sales proceedings on marketing and promoting The Society of Light, I am aiming to maximize their value as much as possible in the secondary market. Remember that trading in the secondary market also means that a portion of royalties will be donated to the same charity.
Art collection and portfolio diversification: Having a collection of avatars that symbolize good deeds is truly satisfying. Investing does not need to only have selfish needs even though there is nothing wrong with investing to make money. But what about investing to make money, help others, and collect art?
Donating to your preferred cause(s): This is a flexible way of allocating different funds to your charities.
A free copy of my book in PDF: Any buyer of any NFT will receive a free copy of my latest book shown in the link of the article.


