
The Chande Momentum Oscillator
Creating the Chande Momentum Oscillator

Momentum oscillators are numerous and their added-value ranges between very bad to acceptable. It is normal that we will not find something very predictive if we are just applying a lag over the price but we can find insights on the recent behavior of the market price. This article discusses one known oscillator called the Chande Momentum Oscillator.
Creating the Chande Momentum Oscillator Step-By-Step
The Chande momentum oscillator is as its name describes it a technical indicator that uses the difference between recent highs and lows divided by their sum in order to gauge the strength of the trend. It is used to measure the relative strength in a market.

If we want to calculate the indicator in Python, we can follow these intuitive steps:
Calculate the sum of the closes that have closed higher during a period.
Calculate the sum of the closes that have closed lower during a period.
Subtract the result of the sum of the lower closes from the sum of the higher closes.
Divide the result from the previous step by the sum of the lower closes and higher closes.
Multiply the result by 100.
//@version=6
indicator(title="Chande Momentum Oscillator", shorttitle="ChandeMO",

format=format.price, precision=2, timeframe="", timeframe_gaps=true)
length = input.int(13, minval=1)
src = input(close, "Source")
momm = ta.change(src)

f1(m) => m >= 0.0 ? m : 0.0
f2(m) => m >= 0.0 ? 0.0 : -m

m1 = f1(momm)
m2 = f2(momm)

sm1 = math.sum(m1, length)
sm2 = math.sum(m2, length)

percent(nom, div) => 100 * nom / div
chandeMO = percent(sm1-sm2, sm1+sm2)

plot(chandeMO, "Chande MO", color=#2962FF)
hline(0, color=#787B86, linestyle=hline.style_dashed, title="Zero Line")
Using the Chande Momentum Oscillator
We use the indicator the same way as we use the RSI. We establish upper and lower boundaries such as 70/-70 as shown in the below chart.

So on the above chart, whenever the indicator reached -70, a bullish signal is generated and whenever it reaches 70, a bearish signal is generated.
This of course works well in ranging markets but will underperform in trending markets. Here’s the code to create the signals as shown by the arrows:
//@version=6
indicator(title="Signals", shorttitle="Signals", format=format.price, precision=2, timeframe="", timeframe_gaps=true, overlay=true)
length = input.int(9, minval=1)
src = input(close, "Source")
momm = ta.change(src)
f1(m) => m >= 0.0 ? m : 0.0
f2(m) => m >= 0.0 ? 0.0 : -m
m1 = f1(momm)
m2 = f2(momm)
sm1 = math.sum(m1, length)
sm2 = math.sum(m2, length)
percent(nom, div) => 100 * nom / div
chandeMO = percent(sm1-sm2, sm1+sm2)

buy = chandeMO < -70 and chandeMO[1] > -70
sell = chandeMO > 70 and chandeMO[1] < 70

plotshape(buy,  style = shape.triangleup, color = color.green, location =  location.belowbar, size = size.small)
plotshape(sell,  style = shape.triangledown, color = color.red, location =  location.abovebar, size = size.small)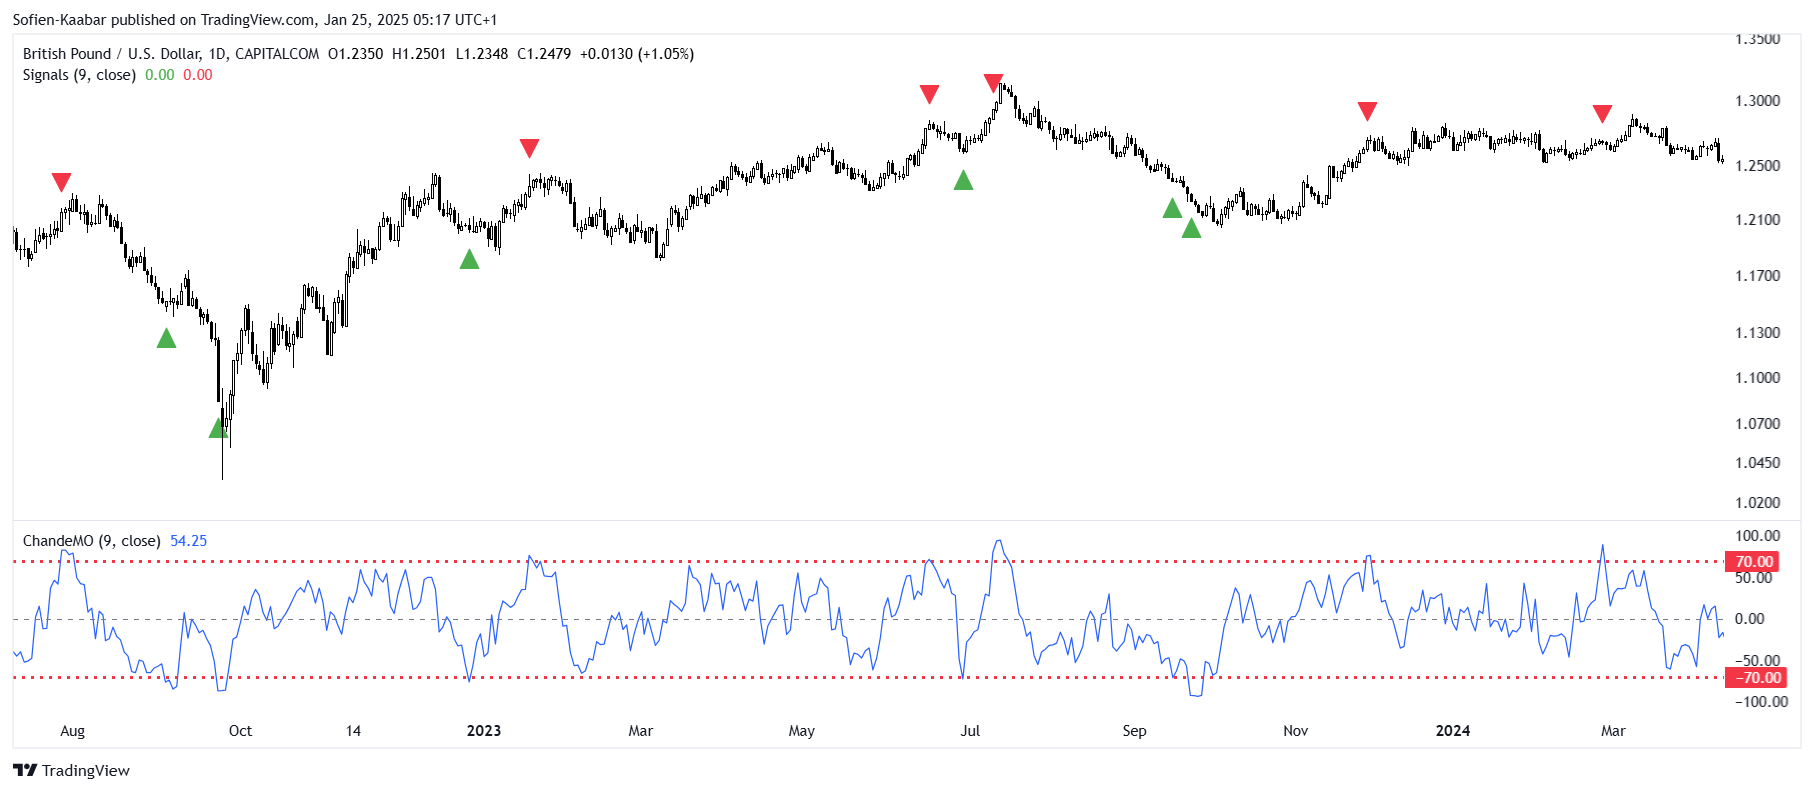
Summary
To sum up, what I am trying to do is to simply contribute to the world of objective technical analysis which is promoting more transparent techniques and strategies that need to be back-tested before being implemented. This way, technical analysis will get rid of the bad reputation of being subjective and scientifically unfounded.
I recommend you always follow the the below steps whenever you come across a trading technique or strategy:
Have a critical mindset and get rid of any emotions.
Back-test it using real life simulation and conditions.
If you find potential, try optimizing it and running a forward test.
Always include transaction costs and any slippage simulation in your tests.
Always include risk management and position sizing in your tests.
Finally, even after making sure of the above, stay careful and monitor the strategy because market dynamics may shift and make the strategy unprofitable.