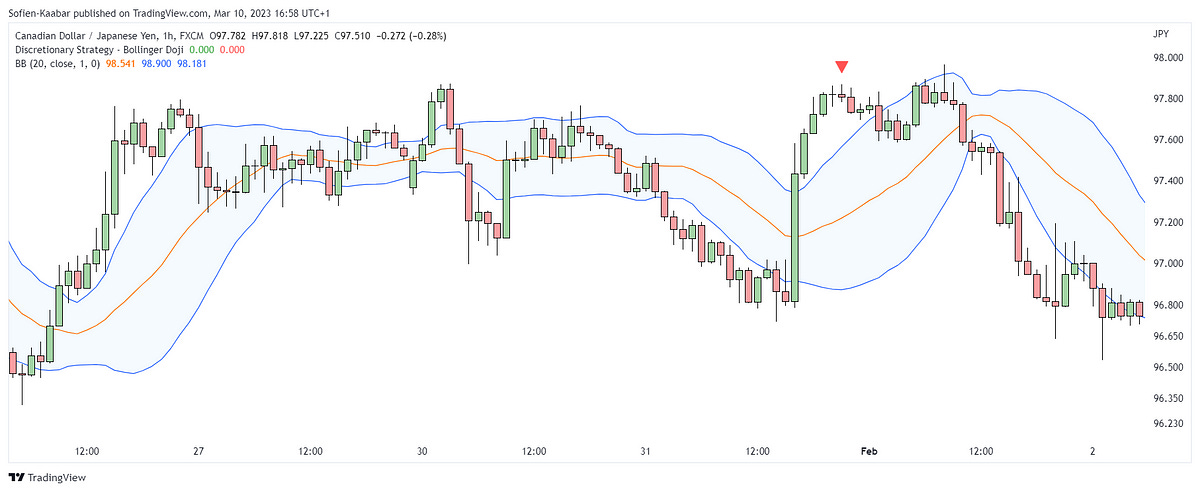
Combining volatility bands with candlestick patterns may be a good idea to confirm the reversal move outside normality boundaries. This article presents the Bollinger Doji strategy coded in TradingView.
The Essence of the Strategy
The strategy is composed of two elements:
Bollinger bands: They are a type of volatility bands that provide dynamic support and resistance levels to help determine market reactions.
Doji pattern: This is a candlestick pattern that signals indecision and a possible reversal in the on-going trend.
The strategy seeks to capitulate when the market is outside its normality bounds while simultaneously forming an indecision price action.
You can also check out my other newsletter The Weekly Market Sentiment Report that sends tactical directional views every weekend to highlight the important trading opportunities using a mix between sentiment analysis (COT reports, Put-Call ratio, Gamma exposure index, etc.) and technical analysis.
Creating the Strategy
As mentioned above, the strategy combines an indicator with a pattern in the following rules:
A long signal is generated whenever a Doji pattern appears while the market is below the lower Bollinger band which uses 1 standard deviation instead of the usual 2.
A short signal is generated whenever a Doji pattern appears while the market is above the upper Bollinger band which uses 1 standard deviation instead of the usual 2.
The following is the code to create this technique in Pine Script (TradingView’s coding language):
// This source code is subject to the terms of the Mozilla Public License 2.0 at https://mozilla.org/MPL/2.0/
// © Sofien-Kaabar

//@version=5
indicator("Discretionary Strategy - Bollinger Doji", overlay = true)

lower_bollinger_band = ta.sma(close, 20) - (1 * ta.stdev(close, 20))
upper_bollinger_band = ta.sma(close, 20) + (1 * ta.stdev(close, 20))

bullish_signal = close > open and close[1] == open[1] and close[2] < open[2] and close < lower_bollinger_band
bearish_signal = close < open and close[1] == open[1] and close[2] > open[2] and close > upper_bollinger_band

plotshape(bullish_signal,  style = shape.triangleup,   color = color.green,  location =  location.belowbar, size = size.small)
plotshape(bearish_signal,  style = shape.triangledown, color = color.red,    location =  location.abovebar, size = size.small)
The following Figure shows a signal chart.
The following Figure shows another signal chart.
The exit rules are quite simple, you exit whenever you reach the upper band in case of a long signal and the lower band in case of a short signal.
This strategy must of course be optimized due to the low frequency and depending on the market, it may not work as expected (especially during trending markets).
You can also check out my other newsletter The Weekly Market Analysis Report that sends tactical directional views every weekend to highlight the important trading opportunities using technical analysis that stem from modern indicators. The newsletter is free.
If you liked this article, do not hesitate to like and comment, to further the discussion!


