
The ATR-Guided RSI - A Powerful New Technical Indicator
Presenting a New Improved Technical Indicator


This article presents a new indicator that filters out RSI signals in an attempt to improve them. It uses the ATR as a way to delay signals until a certain condition is met.
The RSI in a Nutshell
The relative strength index (RSI), developed by J. Welles Wilder Jr. in 1978, is a momentum oscillator designed to measure the speed and magnitude of recent price changes. It captures whether a security is overbought or oversold, providing insight into potential reversal zones or confirmation of trends. Unlike the MACD, which is unbounded and centered around zero, RSI is bounded between 0 and 100, which makes it ideal for identifying extremes in price movement.
The RSI’s core concept is simple: compare average gains to average losses over a specified lookback period, usually 14 periods. If prices have mostly risen during that period, the RSI moves toward 100; if they’ve mostly fallen, the RSI approaches 0.
To construct the RSI, we begin with the basic notion of relative strength — not in a physical sense, but the ratio of bullish to bearish movement in price. Given a series of closing prices P, we compute the price change:

This change is decomposed into two parts:
The upward move (gain).
The downward move (loss).
These values are then smoothed, not simply averaged. Wilder used a type of exponential smoothing in his original formulation, which is a recursive formula similar to EMA:
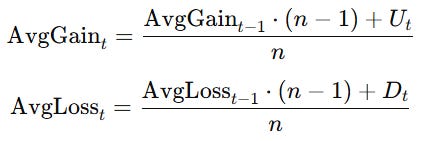
With these averages, we define the relative strength (RS):
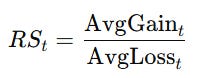
Finally, the RSI itself is calculated by normalizing RS into a 0–100 range:

This formulation ensures that when gains dominate, RS > 1 and RSI moves toward 100; when losses dominate, RS < 1 and RSI falls toward 0.

The RSI is traditionally used to identify overbought or oversold conditions. The key levels are:
RSI > 70: asset may be overbought.
RSI < 30: asset may be oversold.
However, interpreting RSI requires more than just these thresholds.
First, let’s consider what "overbought" and "oversold" truly mean. Overbought does not mean the price will immediately fall — it means the price has risen strongly, and a correction could be near. Likewise, oversold means a strong decline has occurred, not that a rebound is guaranteed. In strong trends, RSI can stay overbought or oversold for long periods. This is where RSI becomes more useful in confirming momentum rather than calling reversals. For example, if RSI remains above 70 during an uptrend, it confirms strength — not necessarily a reason to sell.
Check out my newsletter that sends weekly directional views every weekend to highlight the important trading opportunities using a mix between sentiment analysis (COT report, put-call ratio, etc.) and rules-based technical analysis.

The ATR in a Nutshell
The average true range (ATR) is a technical indicator developed by J. Welles Wilder. Originally designed for commodities markets, the ATR has since become a core volatility metric used across asset classes. It measures market volatility by decomposing the entire range of an asset’s price for a given period. Unlike directional indicators, ATR does not indicate trend strength or price direction—its sole purpose is to assess the degree of price movement.
At its core, the ATR builds upon the concept of true range (TR), which captures the most comprehensive view of price movement by accounting for gaps between trading sessions. The True Range for a given period is the maximum of the following three values:
The current high minus the current low.
The absolute value of the current high minus the previous close.
The absolute value of the current low minus the previous close.
This formula ensures that overnight gaps or sharp one-period reversals are fully captured—something that traditional high-low range measures can miss. Once a series of True Range values is calculated, the ATR is derived by applying a moving average—most commonly an exponential moving average (EMA) or Wilder’s smoothing method—over a user-defined number of periods, often 14 by default. The result is a single value representing the average volatility over that lookback period.
A high ATR reading indicates heightened volatility, often appearing during market corrections, earnings reports, or geopolitical shocks. Conversely, a low ATR typically signals periods of consolidation or tight trading ranges, which may precede a breakout.
Importantly, ATR is non-directional: it rises in both falling and rising markets if price movement is increasing. This neutrality makes it a reliable input for assessing risk, rather than momentum. It’s especially valuable in systematic trading and algorithmic models, where volatility normalization is critical. Because of its smoothing process, ATR responds gradually to changes in volatility, reducing noise while remaining responsive enough to detect shifts in market behavior.
The ATR-Guided RSI
The ATR-guided RSI is a unique technical indicator that combines volatility and momentum analysis for enhanced signal filtering. This tool works by:
Calculating the RSI based on price data.
Applying an ATR calculation to the RSI values (specifically using RSI high, RSI low, and RSI close).
Computing the highest ATR value over the last 500 periods to define a dynamic volatility threshold.
Plotting both the ATR of RSI and its highest high line for clear visualization.
The signals are foun as follows:
Green dots are plotted at the RSI when it falls below 30 (oversold condition).
Red dots are plotted at the RSI when it rises above 70 (overbought condition).
A bullish signal is triggered when a green dot appears and the ATR of RSI is equal to its 200-period highest value — indicating a strong oversold momentum under heightened volatility.
A bearish signal is triggered when a red dot appears and the ATR of RSI is at its highest — suggesting an overheated market under high volatility.


This combination aims to capture moments when momentum extremes (RSI overbought/oversold) align with peak volatility conditions, potentially offering higher-quality trading signals.
//@version=6
indicator("ATR-Guided RSI")

length      = input(defval = 14, title = 'Window')
rsi_high    = ta.rsi(high, length)
rsi_low     = ta.rsi(low, length)
rsi_close   = ta.rsi(close, length)

rsi_atr(length) =>
    trueRange = na(rsi_high[1])? rsi_high-rsi_low : math.max(math.max(rsi_high - rsi_low, math.abs(rsi_high - rsi_close[1])), math.abs(rsi_low - rsi_close[1]))
    ta.rma(trueRange, length)

highest_high = ta.highest(rsi_atr(length), 500)

plot(rsi_atr(length))
plot(highest_high, color=color.black, linewidth=2)

plotshape(rsi_close < 30, color = color.green, style=shape.circle, size=size.small)
plotshape(rsi_close > 70, color =color.red, style=shape.circle, size=size.small)🔥Deep Learning for Finance! Master the future of financial modeling with fractional differentiation, LSTM forecasting, multi-period predictions, and machine learning for time series. A must-read for serious quants and traders.
The following chart shows a zoomed out version of the indicator. Make sure to understand that it’s only an added filter. The ATR-guided RSI does not pretend to be any better than the RSI. All it does is add a volatility filter that just predicts where a structural break will occur in tandem with an oversold/overbought RSI.

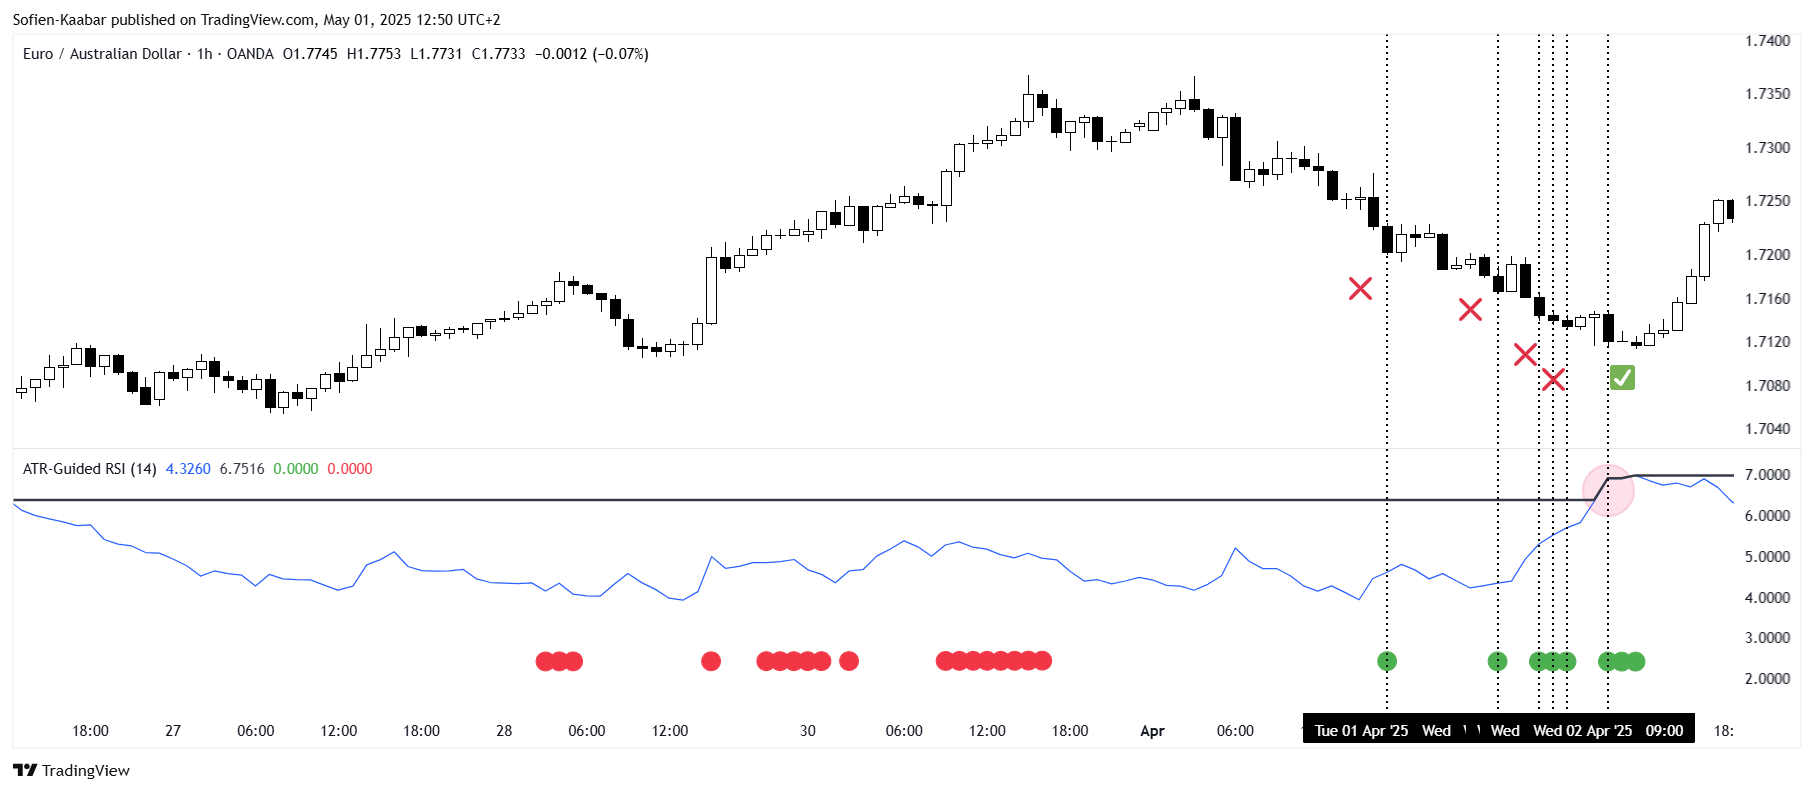
The parameters of this indicator are debatable. You can tweak them as much as you want to find a sweet spot. The following chart shows how the delayed signals by the ATR-guided RSI helped us find a better bullish reversal signal.
The following chart shows that during a strong trending market, even the filter cannot do much, despite it predicting a small correction.

The following chart shows another example of a good delayed signal where the true signal was triggered when the ATR of the RSI reached the 500-period high while the 14-period RSI was above 70.

In summary, it helps sometimes to fuse certain indicators with specific conditions to get another angle.