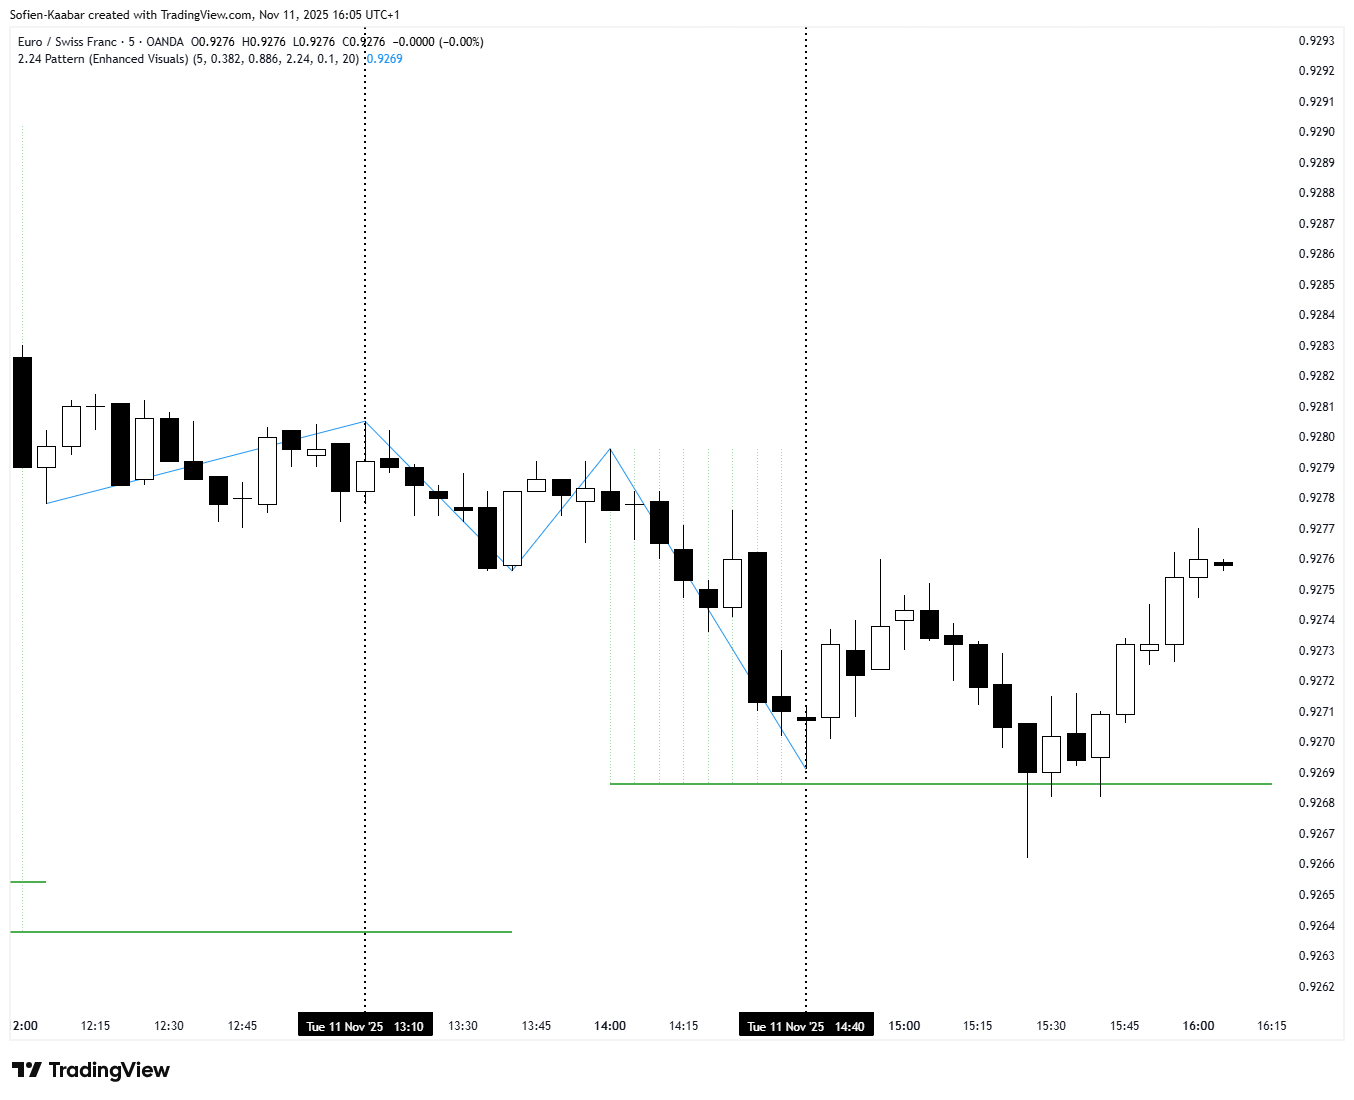
The ABCD pattern is one of the oldest and simplest chart patterns in technical analysis. And for good reason. It’s easy to spot, easy to apply, and gives you a framework for measuring risk and potential reward in fast-moving markets.
But what if I told you there’s a specific variation of this pattern that can help you detect outstretched market reversals—moves that have gone too far, too fast, and are ripe for a snapback?
That’s where my 2.24 BC variation comes in. But first, let’s lay the groundwork.
The Arrow Pattern
If you’re already familiar, feel free to skip. But it’s worth quickly outlining what we’re working with.
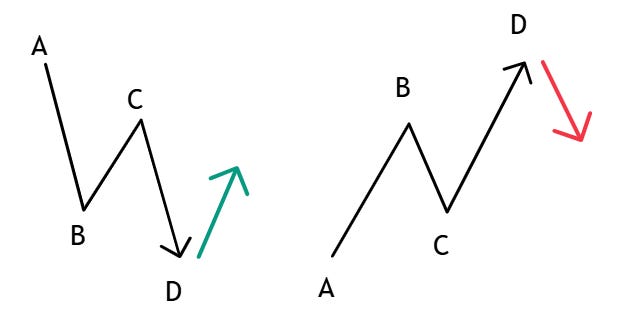
The ABCD pattern is built around three key legs:
AB: The initial impulse move.
BC: A retracement, usually anywhere from 61.8% to 78.6% of AB.
CD: A move in the same direction as AB, often equal in length to AB.
In a bullish ABCD:
A to B is a strong move up.
B to C is a retracement down.
C to D is another leg up—ideally equal to AB.
In a bearish ABCD:
A to B is a sharp move down.
B to C is a retracement bounce.
C to D is another move down—again, ideally equal to AB.
It’s a pattern of symmetry. When CD mirrors AB in size and duration, traders start watching for exhaustion. It often becomes a high-probability reversal zone.
Markets aren’t always symmetrical.
In real-time trading, you’ll often see the CD leg go way past AB. Or BC will barely retrace, and CD just takes off like a rocket. The standard ABCD pattern breaks down when markets stretch—usually during news catalysts, panics, or euphoric breakouts.
That’s where most traders get faked out. They wait for the picture-perfect ABCD to complete, but by the time it does, the move’s already over—or worse, they’re buying CD thinking it has more room, and it reverses hard.
So I started asking a different question:
What if the extreme versions of the ABCD—where the symmetry breaks—actually tell us more about when a move is about to exhaust?
This is the variation I’ve been testing and using to spot outstretched market reversals—when things go too far.
Here’s how it works:
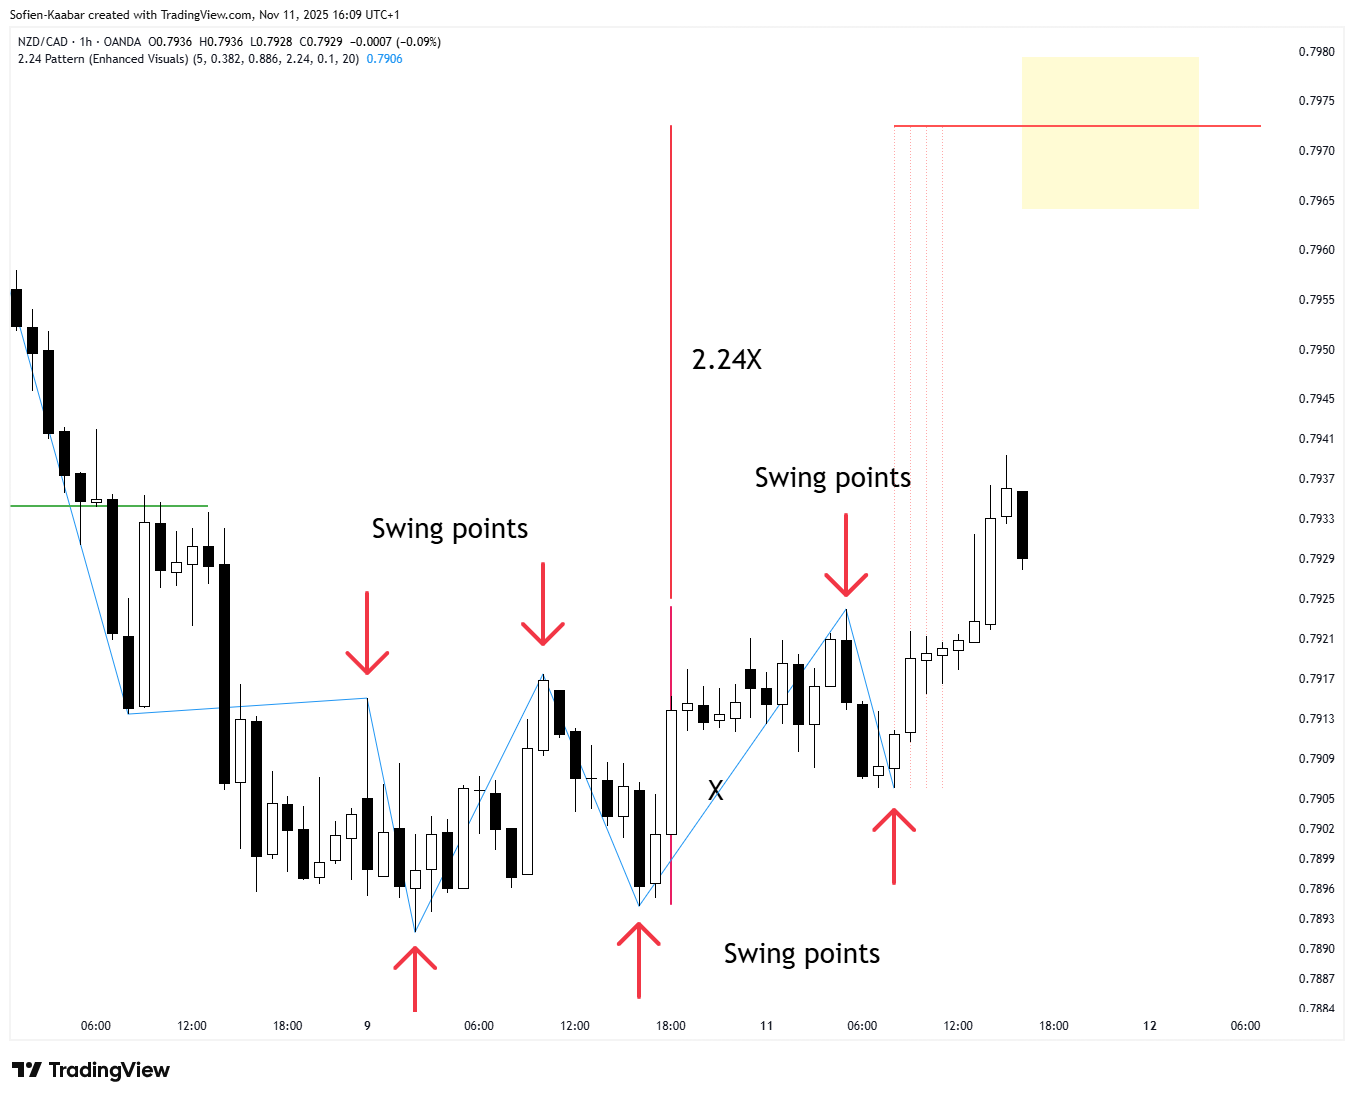
You start with a strong AB leg.
Then you get a shallow retracement—BC retraces only 38.2% or less of AB.
Now here’s the twist: you measure BC and project it forward 2.24x from point C. That gives you a potential D point.
This means:
Instead of expecting CD to equal AB, I’m projecting CD to be 2.24 times BC.
This typically happens in markets that are overextended. Think: parabolic runs, vertical spikes, panic flushes. When CD blows past the AB leg, this 2.24 multiplier gives you a calculated way to anticipate the exhaustion zone—not just guess.
🚨🚨Access cutting-edge market forecasts!
Our platform, Quant Atlas has a 10-day Free trial now, so you can check out daily forecasts of 150+ markets ranked by conviction!
Detecting the Arrow Pattern
Why 2.24?
It’s not random. After hundreds of chart studies, I kept noticing a pattern: the CD leg in these runaway moves would often reach around 2x to 2.24x the length of BC before reversing hard.
2.24 started showing up more frequently than the usual 1.618 Fibonacci extension. It seemed to mark the “overcooked” zone—where euphoria hits a wall or panic burns out.
In other words, 2.24BC = D became my new signal for potential reversal. (also 2.24 = 1.618 + 0.618)
This is especially useful in fast, emotional markets. You’re not relying on symmetry or textbook setups—you’re tracking momentum and stretch. The more vertical CD becomes, the more likely it is to climax near that 2.24 level.
Let’s say a stock rips from $20 to $30 (AB), then pulls back to $27 (BC = 3 points). Most would look for CD to match AB, projecting to $37.
But in a 2.24 BC scenario, you’d measure 3 points x 2.24 = 6.72 points. Add that to point C ($27), and you get $33.72 as a target for a potential reversal—not $37.
When everyone else is watching for the CD leg to stretch to $37, you’re already lining up a reversal play near $33.72.
It’s about getting ahead of the crowd. And more importantly, it’s about understanding when a move is overcooked, not just trending.
Use the following code to create the simple scanner:
//@version=4
study(”2.24 Pattern (Enhanced Visuals)”, overlay=true, max_bars_back=5000)

length      = input(5, “Pivot length”)
minRetrace  = input(0.382, “Min BC retracement”)
maxRetrace  = input(0.886, “Max BC retracement”)
cdRatio     = input(2.24, “Target CD/AB ratio”)
tolerance   = input(0.1, “CD ratio tolerance”)
lineLength  = input(20, “Projection line length (bars)”)

up1 = pivothigh(high, length, length)
dn1 = pivotlow(low, length, length)

upcount = barssince(not na(up1))
dncount = barssince(not na(dn1))

ppp = (not na(dn1) and dncount[1] > upcount[1]) ? dn1 :
      (not na(up1) and dncount[1] < upcount[1]) ? up1 : na

n  = bar_index
a  = valuewhen(not na(ppp), n, 2)
b  = valuewhen(not na(ppp), n, 1)
c  = valuewhen(not na(ppp), n, 0)

av = valuewhen(not na(ppp), ppp, 2)
bv = valuewhen(not na(ppp), ppp, 1)
cv = valuewhen(not na(ppp), ppp, 0)

ab = bv - av
bc = cv - bv

bear_ok = av < bv and
          (bv - cv) <= (maxRetrace * (bv - av)) and
          (bv - cv) >= (minRetrace * (bv - av)) and
          (cv >= av)

if (bear_ok)
    d_price_bear = cv + (bv - av) * cdRatio
    // Draw short horizontal resistance
    line.new(x1=bar_index - length, y1=d_price_bear,
             x2=bar_index - length + lineLength, y2=d_price_bear,
             color=color.new(color.red, 0), width=2)
    // Draw connector from C pivot (at cv) to start of resistance
    line.new(x1=bar_index - length, y1=cv,
             x2=bar_index - length, y2=d_price_bear,
             color=color.new(color.red, 50), width=1, style=line.style_dotted)

bull_ok = av > bv and
          (cv - bv) <= (maxRetrace * (av - bv)) and
          (cv - bv) >= (minRetrace * (av - bv)) and
          (cv <= av)

if (bull_ok)
    d_price_bull = cv - (av - bv) * cdRatio
    // Draw short horizontal support
    line.new(x1=bar_index - length, y1=d_price_bull,
             x2=bar_index - length + lineLength, y2=d_price_bull,
             color=color.new(color.green, 0), width=2)
    // Draw connector from C pivot (at cv) to start of support
    line.new(x1=bar_index - length, y1=cv,
             x2=bar_index - length, y2=d_price_bull,
             color=color.new(color.green, 50), width=1, style=line.style_dotted)

plot(ppp, “pivot line”, offset=-length, color=color.new(color.blue, 0))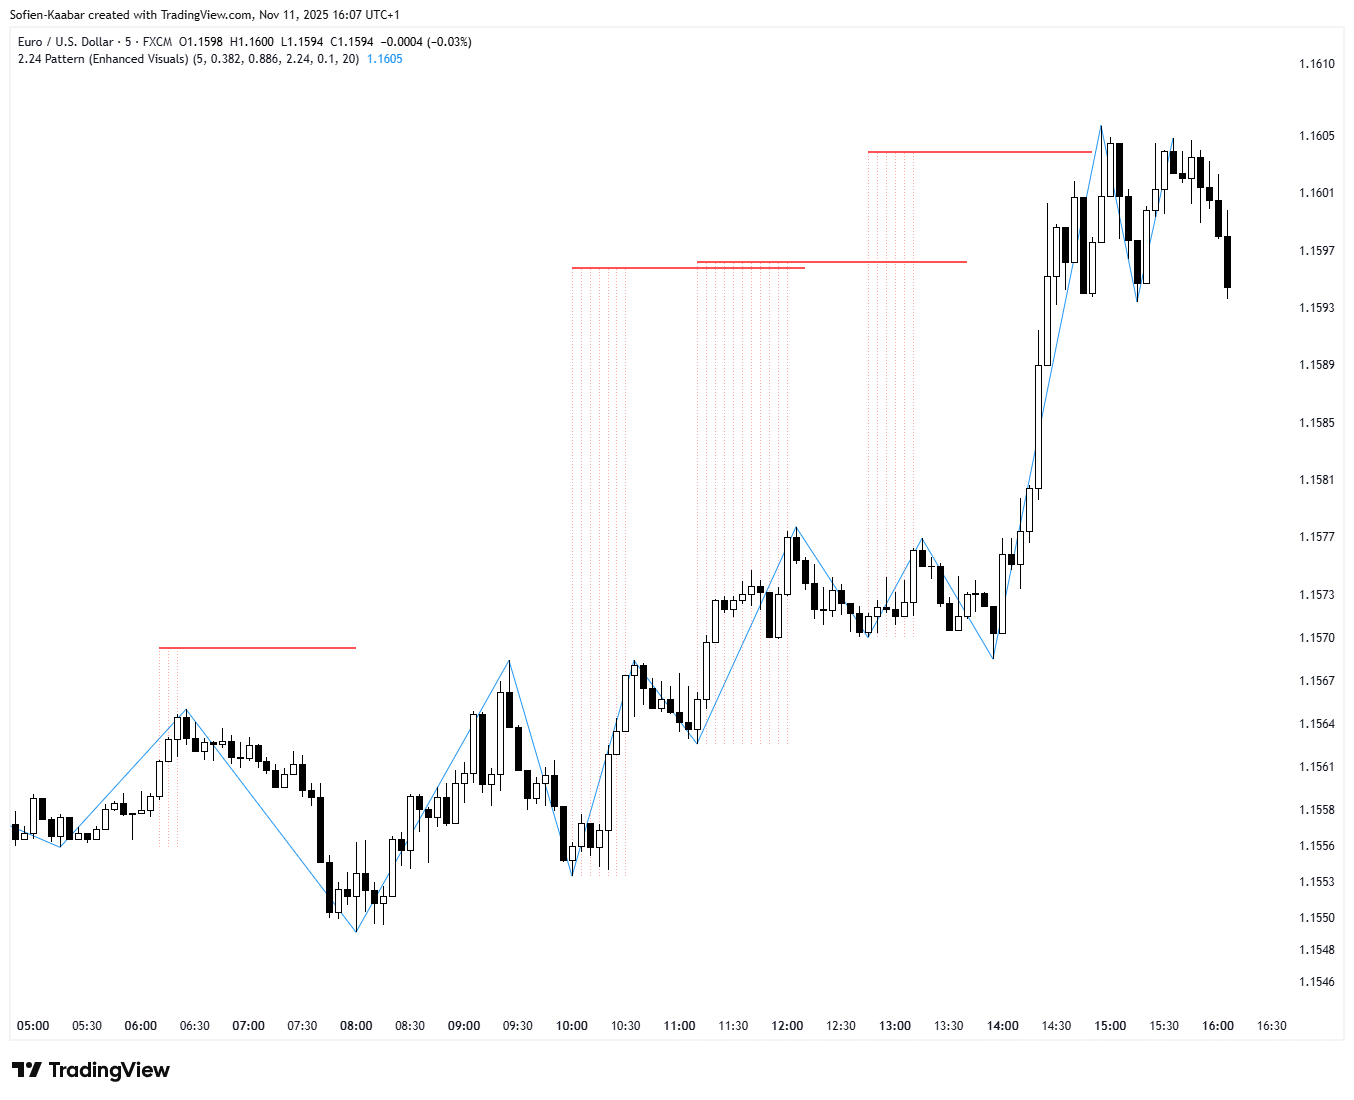
I don’t treat this pattern like gospel. It’s not a magic number. But it’s a lens.
When I see a compressed BC leg and a fast, vertical CD leg, I anchor a 2.24x projection from point C. That gives me a real-time target zone where I’ll look for:
Volume climax
Exhaustion wicks
Divergences
Trendline breaks
Aggressive fades
It’s not just about the number. It’s about watching behavior when price reaches that 2.24 BC extension. That’s the moment to strike—or step back if things don’t confirm.
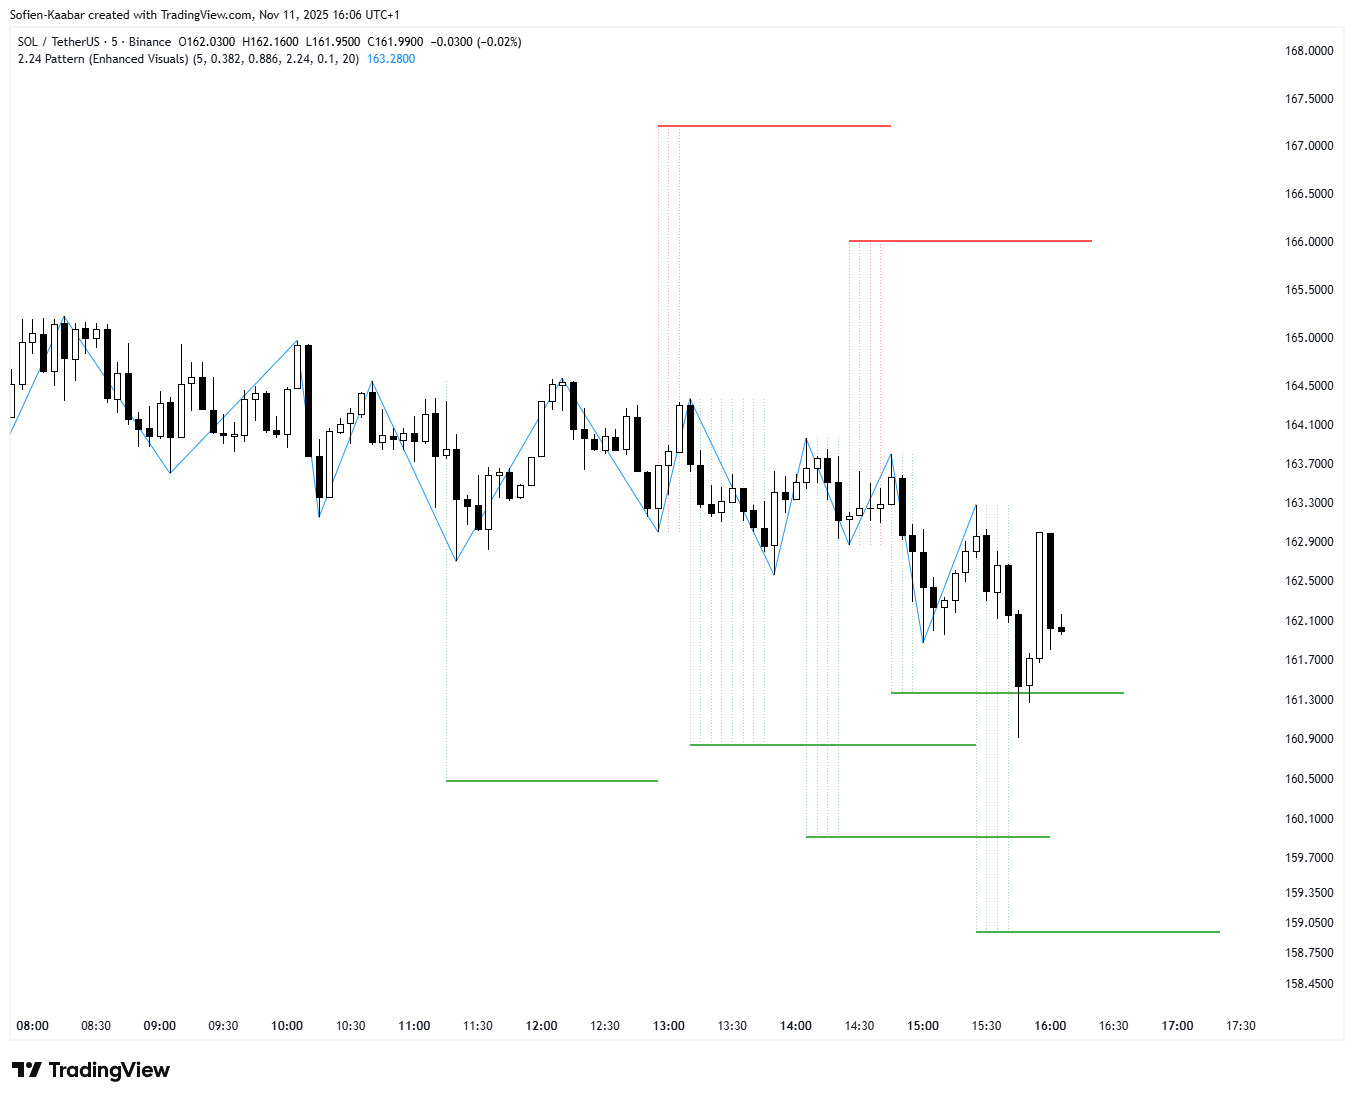
The classic ABCD pattern is a great starting point. But markets have evolved. They move faster, fake out more, and punish symmetry-based assumptions.
The 2.24 BC variation is my way of adapting. It’s built to detect outstretched market behavior—where speed, emotion, and momentum collide.
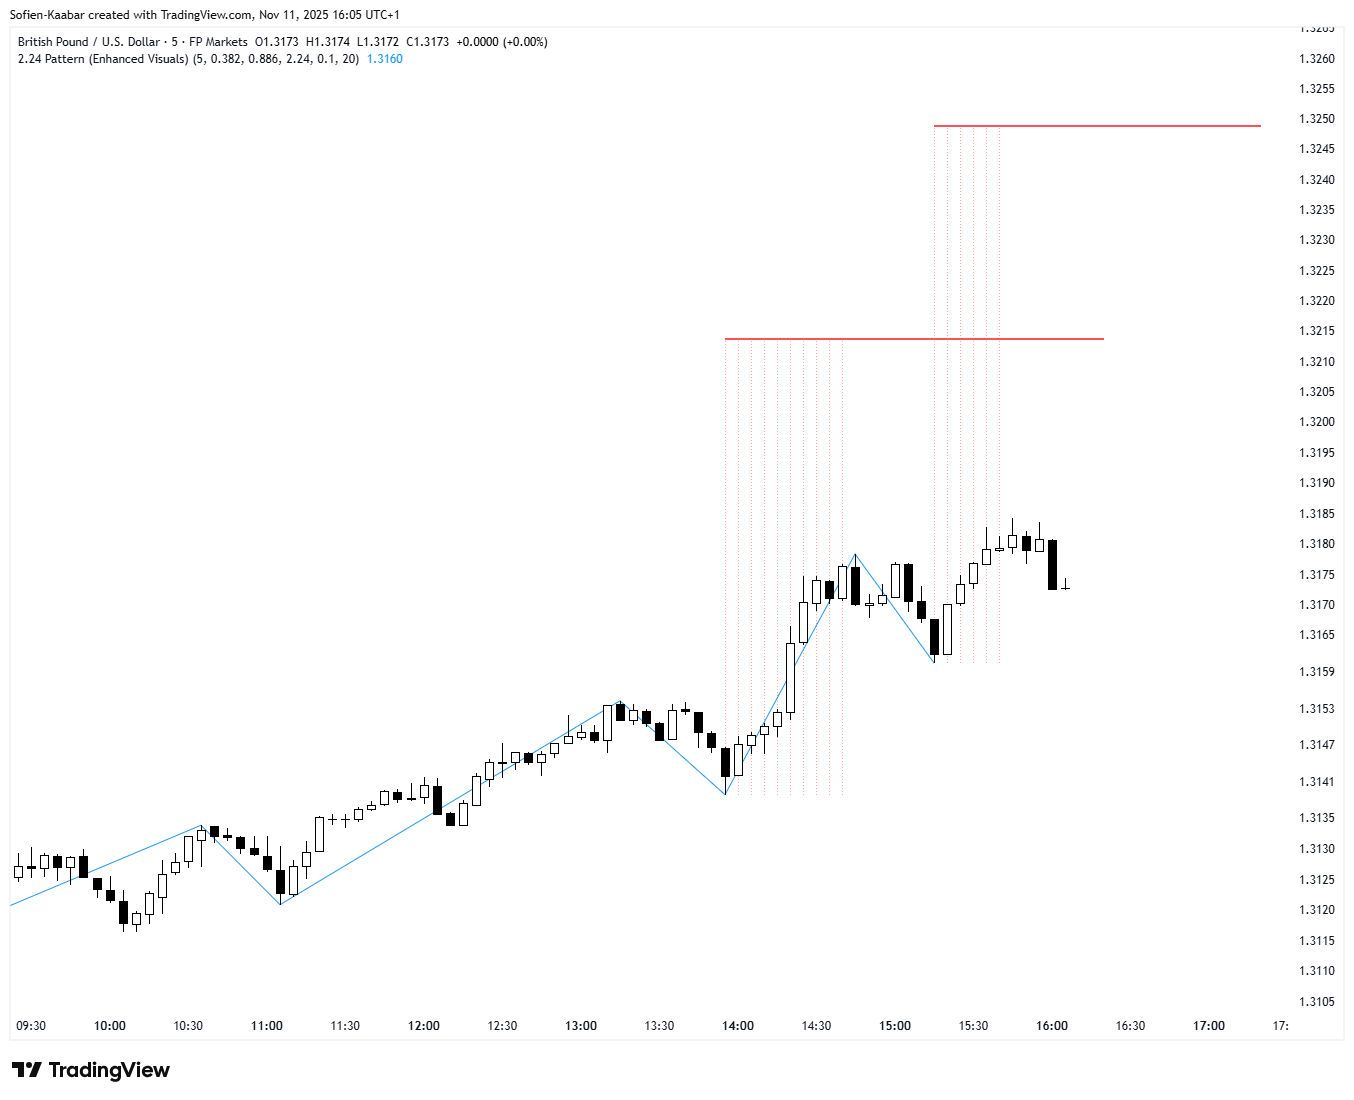
If you trade high-volatility names or anything that tends to spike hard and fade just as fast, this tool is worth adding to your arsenal. It doesn’t replace context, but it gives you a mathematical edge in chaotic conditions.
Start watching it. Mark it on your charts. And see how often the 2.24 projection lines up with a turning point.