


Squared Strength - Elevate Your Technical Indicators
Amplifying the RSI for Better Market Insights


The relative strength index (RSI) is a widely-used momentum oscillator in technical analysis, providing insights into overbought and oversold market conditions. However, traditional RSI values can sometimes underperform (especially with simple strategies).
This article introduces an advanced adaptation known as RSI square or RSI²—a technique involving the application of the RSI’s formula over an initial RSI already applied on the market price. The aim is to refine and amplify the strength of momentum signals.
The RSI² technique enhances sensitivity to high-momentum moves and intensifies the contrast between stronger and weaker signals, making it particularly useful for identifying turning points in extreme market conditions. By going deeper with the formula, this approach effectively detects intermediate reactions, providing a clearer indication of hidden overbought or oversold conditions, while reducing the likelihood of false positives that can arise in standard RSI interpretation.
Furthermore, RSI² helps traders pinpoint reversal zones that are otherwise undetected using the regular RSI. This modified indicator thus appeals to traders seeking enhanced clarity in their momentum analysis, particularly those focused on markets with rapid trend reversals. Throughout the paper, we delve into the methodology, mathematical implications, and practical application of RSI², highlighting its advantages over the traditional RSI in optimizing entry and exit strategies.
Introduction to the RSI
Also known as the father of all indicators, the RSI is the go-to tool for most technical analysts, traders, and investors. This is why it’s important that you master it. Developed by J. Welles Wilder Jr. in the 70’s and introduced in his book New Concepts in Technical Trading, the RSI is an oscillator calculated purely from the close price and bound between 0 and 100.
It measures the speed and change of price movements and is primarily used to find overbought (70) and oversold (30) conditions. But first, let’s see how to calculate the RSI. The first step is to determine the price change for each period within the chosen time frame (typically 14 periods). The price change for each period is calculated by subtracting the previous closing price from the current closing price:

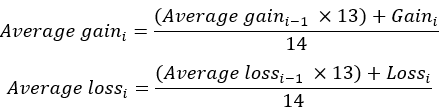
If the result is positive, it’s a gain. If the result is negative, take its absolute value and consider it a loss (therefore, separating the two and keeping two columns representing gains and absolute losses). Once you have the price changes for each period, the next step is to calculate the average gain and average loss over the specified period (14 days in this example). The initial average gain and average loss are calculated as follows:
After calculating the initial average gain and loss, the subsequent average gain and loss are smoothed using the following formula:
The relative strength (RS) is calculated by dividing the average gain by the average loss:

Finally, the RSI is calculated using the RS value in the RSI formula:
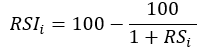
As new data comes in, the RSI is recalculated with the new closing prices, continuously updating to reflect the latest market conditions. The smoothing process ensures that the RSI reacts to recent price changes but is also influenced by the past 14 periods, providing a balanced view of momentum. Figure 1 shows the S&P 500 with its 14-day RSI.

The RSI’s values usually increase when prices are rising and decrease when prices are falling. This reflects the oscillator's design, which calculates relative gains and losses over a set period (commonly 14 periods). However, because RSI is based on the ratio of average gains to average losses, it captures the momentum or speed of price changes, rather than directly correlating to price level changes.
In sum, the RSI generally correlates with market price movement, aligning with price trends and reflecting momentum strength. However, it offers additional insights by revealing overbought/oversold conditions, which can sometimes provide a leading indication of trend reversals or corrections. This nuanced relationship between the RSI and price makes it a valuable tool for timing entries and exits with added confirmation from price trends.
The next section discusses the key indicator of this paper, a simple transformation or add-on relating to the RSI.
Calculating the RSI²
So far, we have applied the RSI’s formula on the close price. This means that the source value of the RSI is the time series’ close price. But what if the source price of the RSI was the RSI itself? The RSI² is an indicator that has the aim of predicting the RSI’s future direction, which in turn predicts the market’s next direction. The steps required to calculate the RSI² are as follows:
Calculate a 14-period RSI with the source value set to the close price.
Calculate an 8-period RSI with the source value set to the RSI from the previous step.
The RSI² is inherently more volatile than the original RSI since it uses a smaller lookback period. Figure 2 shows the S&P 500 with its 8-day RSI² applied on the 14-day RSI.

The blue line in the second panel shows the values of the RSI². Whenever it is around 30, it indicates that the current 14-period RSI is likely to turn up, which may coincide with a market recovery as well. On the other hand,, whenever it is around 70, it indicates that the current 14-period RSI is likely to stall, which may coincide with a market correction. It is worth noting that the correlation between the 14-period RSI and its underlying market is very high. However, correlation does not indicate causality, and certainly, the RSI does not drive the market.
Figure 3 shows the same chart with both indicators in the second panel. The RSI (in blue) tracked by the RSI² (in red).

A Simple Back-test
To evaluate the practical application and effectiveness of the RSI² compared to the traditional RSI, this section presents a back-test of a simple trading strategy that use each indicator to generate buy and sell signals. By testing on historical price data across different markets, we aim to assess each technique's accuracy in identifying profitable entry and exit points. The back-testing process involves analyzing metrics such as win rate (hit ratio), profit factor, and expectancy to determine whether the RSI² offers a measurable advantage over the classic RSI in terms of overall performance and trade timing. This comparison will provide insights into the potential benefits of adopting RSI² for enhanced precision in trading strategies.
The conditions of the strategy will be as follows:
A bullish position is entered whenever the 14-day RSI crosses over 30. The position is held for a period of 20 days.
A bearish position is entered whenever the 14- day RSI crosses under 70. The position is held for a period of 20 days.
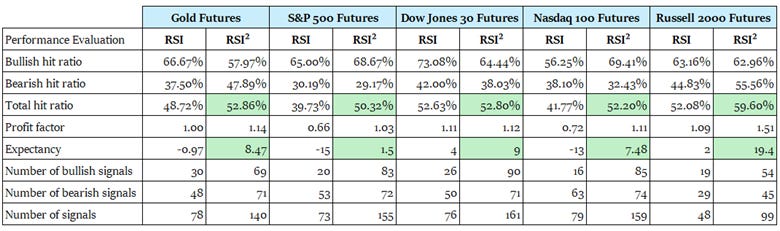
Similarly, the same strategy is applied using the 8- day RSI². The back-testing period is from 2015 using daily bars. The following table shows the results of the strategy.
Check out my newsletter that sends weekly directional views every weekend to highlight the important trading opportunities using a mix between sentiment analysis (COT report, put-call ratio, etc.) and rules-based technical analysis.

The RSI² seems to outperform across the five chosen markets over the selected period. The positive expectancy metric across the board shows interesting potential for the indicator to add value to the overall investment and trading framework.
Conclusion
The back-testing results presented in this paper suggest that the RSI² technique holds promise as a refinement of traditional RSI, offering slightly improved performance in identifying momentum shifts and overbought/oversold conditions. The new approach enhances the sensitivity of signals in high-volatility periods, helping to clarify potential reversal zones and providing traders with greater precision for their entry and exit points.
However, while initial tests show that RSI² may outperform classic RSI under certain conditions, further research is needed to fully validate these findings. In particular, exploring its effectiveness across different asset classes, timeframes, and market environments will help determine the technique’s robustness and adaptability. This study serves as an initial step toward understanding RSI²’s potential as a valuable tool in technical analysis, paving the way for more comprehensive studies and refinements in the future.