Simple RSI Pattern Recognition for Trading Signals
Applying Simple Pattern Recognition on the RSI
The ABCD pattern is a well known configuration with many variations. This article presents the simple version and applies it on the RSI in order to generate trading signals.
The Simplified ABCD Pattern and the RSI
An ABCD formation is a 4-point structure where the last point signals a reversal. Typically the ABCD refers to the fact that the AB leg is equal to the CD leg, implying symmetry.
The theoretical bullish ABCD pattern looks like this:
The theoretical bearish ABCD pattern looks like this:
Let’s discuss the other part of the pattern recognition system we’re creating.
The Relative Strength Index (RSI) is a popular technical indicator used in trading to measure the strength of a financial instrument’s price action. The RSI is a momentum oscillator that compares the size of recent gains to recent losses in an attempt to determine overbought and oversold conditions of an asset.
The RSI is calculated using a formula that takes into account the average gains and losses over a specified time period (usually 14 or 21 periods). The RSI ranges from 0 to 100, with readings above 70 typically considered overbought, and readings below 30 considered oversold.
Traders often use the RSI to identify potential trend reversals, as well as to confirm the strength of a trend. For example, if a security is trending upwards and the RSI remains above 50, it may indicate that the trend is strong and likely to continue. Conversely, if the RSI falls below 50, it may suggest that the trend is weakening and a potential reversal may be forthcoming.
For the complete collection of candlestick patterns in detail with back-tests and technical strategies, you can check out my newest book with O’Reilly Media. The book features a huge number of classic and modern candlestick patterns as it dwelves into the realm of technical analysis with different trading strategies. The book comes with its own GitHub and is dynamic in nature as it is continuously updated and questions are answered on the O’Reilly platform promptly.
Mastering Financial Pattern Recognition
Amazon.com: Mastering Financial Pattern Recognition eBook : Kaabar, Sofien: Kindle Storewww.amazon.com
Coding the Trading Technique in TradingView
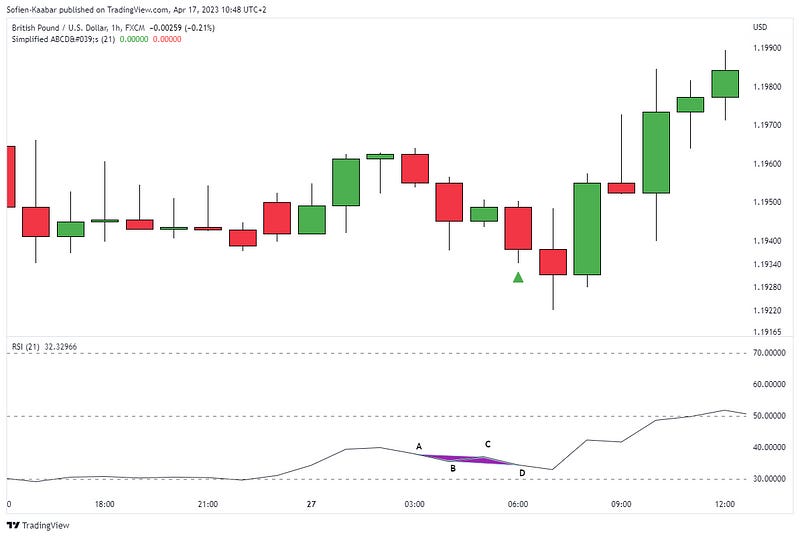
The technique is all about finding simple ABCD patterns (successive points) on the RSI. The following Figure shows an example of the simple ABCD on the RSI:
// This source code is subject to the terms of the Mozilla Public License 2.0 at https://mozilla.org/MPL/2.0/
// © Sofien-Kaabar

//@version=5

indicator("Simplified ABCD's", overlay = true)

lookback = input(defval = 13, title = 'Lookback')

rsi = math.round(ta.rsi(close, lookback), 0)

bullish_abcd = rsi < 40 and rsi[1] > rsi and rsi[1] < 40 and rsi[1] > rsi[2] and rsi[2] > rsi and rsi[2] < rsi[3] and (rsi[3] - rsi[2]) == (rsi[1] - rsi)
bearish_abcd = rsi > 60 and rsi[1] < rsi and rsi[1] > 60 and rsi[1] < rsi[2] and rsi[2] < rsi and rsi[2] > rsi[3] and (rsi[3] - rsi[2]) == (rsi[1] - rsi)

plotshape(bullish_abcd,  style = shape.triangleup,   color = color.green,  location =  location.belowbar, size = size.small)
plotshape(bearish_abcd,  style = shape.triangledown,   color = color.red,  location =  location.abovebar, size = size.small)
The following Figure shows more signals on GBPUSD:
A normal ABCD pattern may have non successive points but a simple ABCD must have successive points that satisfy the condition of equality.
The following Figure shows more signals:


