
Presenting and Back-testing the 3–2–2 Candlestick Pattern
Back-testing the 3–2–2 Pattern in the Strat Price Action Technique

Candlestick patterns are an amazing pattern recognition tool that needs to be studied more. This article discusses the 3–2–2 pattern that is applied using the Strat indicator, a technique discussed in a previous article.
It is finally out! My newest book with O’Reilly Media on candlestick pattern recognition is now available on Amazon! The book features a huge number of classic and modern candlestick patterns as it dwelves into the realm of technical analysis with different trading strategies. The book comes with its own GitHub and is dynamic in nature as it is continuously updated and questions are answered on the O’Reilly platform.
Mastering Financial Pattern Recognition
Amazon.com: Mastering Financial Pattern Recognition eBook : Kaabar, Sofien: Kindle Storewww.amazon.com
Refresher on the Strat Indicator
Candlestick charts are among the most famous ways to analyze the time series visually. They contain more information than a simple line chart and have more visual interpretability than bar charts.
A candlestick is a box-shaped chronological element composed of OHLC data which helps determining the trend but also gives more information on volatility and market psychology.
A bullish candlestick is generally green (or white) and occurs whenever the close price is higher than the open price.
A bearish candlestick is generally red (or black) and occurs whenever the close price is lower than the open price.

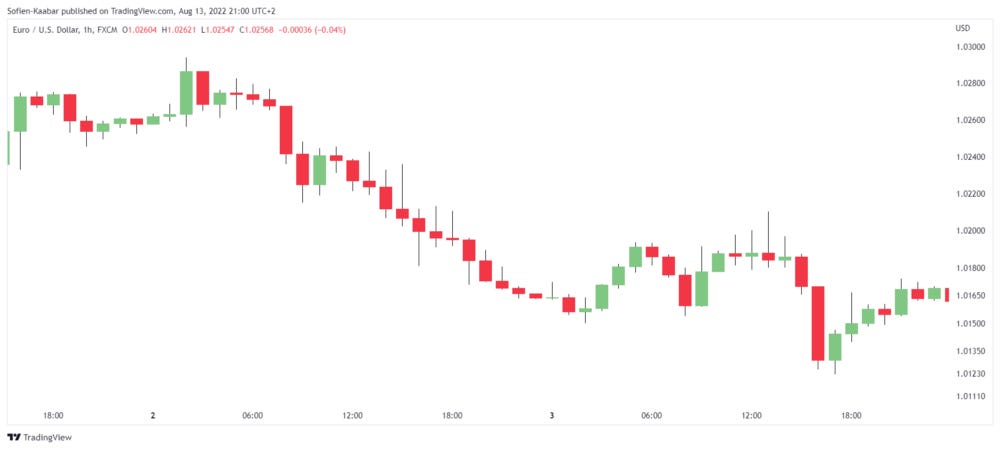
The next chart shows a candlestick chart on EURUSD. The time frame used is hourly. What can you say about the trend seen?
The Strat indicator is an overlay technique which means that its information (or values) appear on the same chart as the candlesticks as opposed to independent indicators that are charted in a different panel (e.g. the RSI).
Created by Rob Smith, the Strat indicator aims to categorize candlesticks based on their position relative to the previous ones.
Inside bar (labeled as 1): The candle is completely within the high and low of the previous candle. An inside bar represents indecision.
Directional bar (labeled as 2): The candle extends above or below either the high or low of the previous candle.
Outside bar (labeled as 3): The candle extends both above and below either the high or low of the previous candle.
The color of the candles are not extremely important in the Strat indicator. The following Figure shows a theoretical illustration of an inside bar.

The following Figure shows a theoretical illustration of a directional bar.

The following Figure shows a theoretical illustration of an outside bar.

Inside bars may represent a pause in the current move and may signal a reversal or a consolidation. Directional bars represent a continuation of the move (the market is still in the middle of the established trend).
Getting healthier means changing your lifestyle. Noom Weight helps users lose weight in a sustainable way through behavioral change psychology. It's a no-brainer.

The 3–2–2 Pattern
If you have read my previous articles (or books), then you should have an idea on how to import and manipulate financial time series in Python. To make this section short, I will only show the signal function which is the function that contains the necessary conditions that reflect the needed pattern. Just keep in mind the following variables:

Now, the 3–2–2 is a reversal candlestick pattern that comes from using the Strat technique. The theoretical illustrations are as shown below.


Therefore, the trading conditions are as follows:
A bearish 3–2–2 reversal pattern is validated when an outside bullish candle is printed and followed by a directional down candle. The bullish signal is given when a new candle surpasses the high of the directional down candle and the target is set to the high of the outside candle.
A bearish 3–2–2 reversal pattern is validated when an outside bearish candle is printed and followed by a directional up candle. The bearish signal is given when a new candle breaks the low of the directional up candle and the target is set to the low of the outside candle.
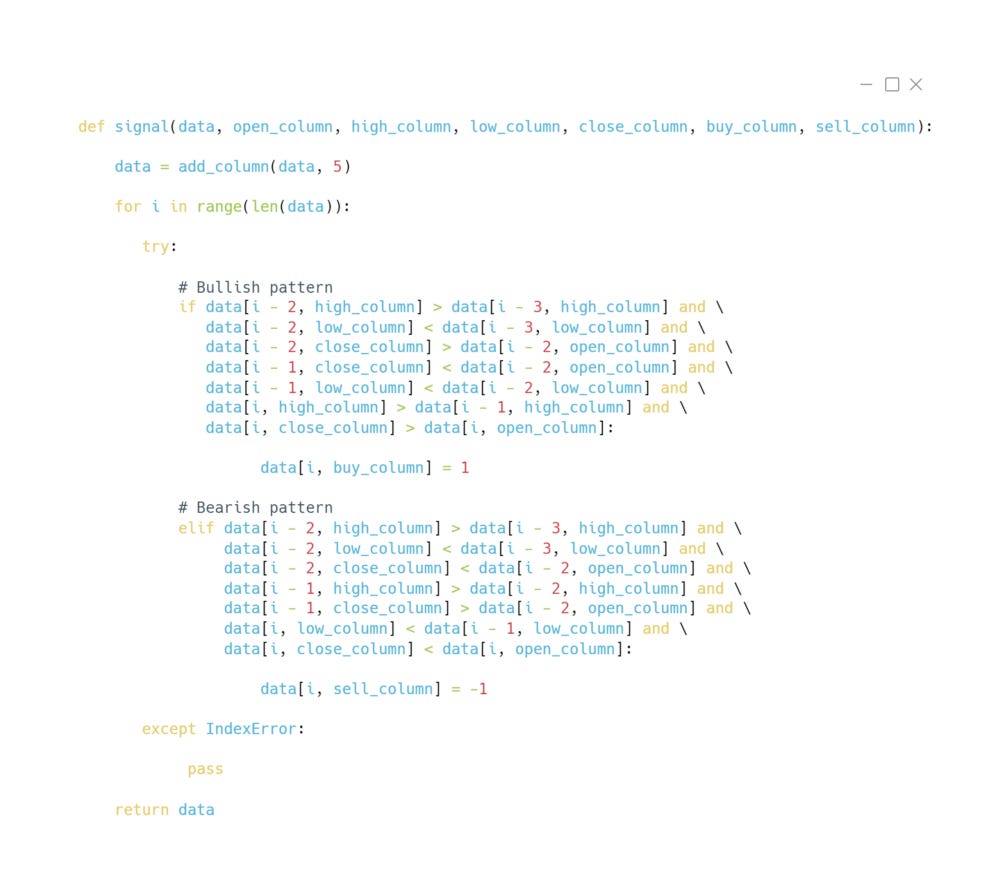
The signal function in Python can be coded as follows (keep in mind the variables used to help guide you):
The next Figure shows a signal chart on USDJPY.
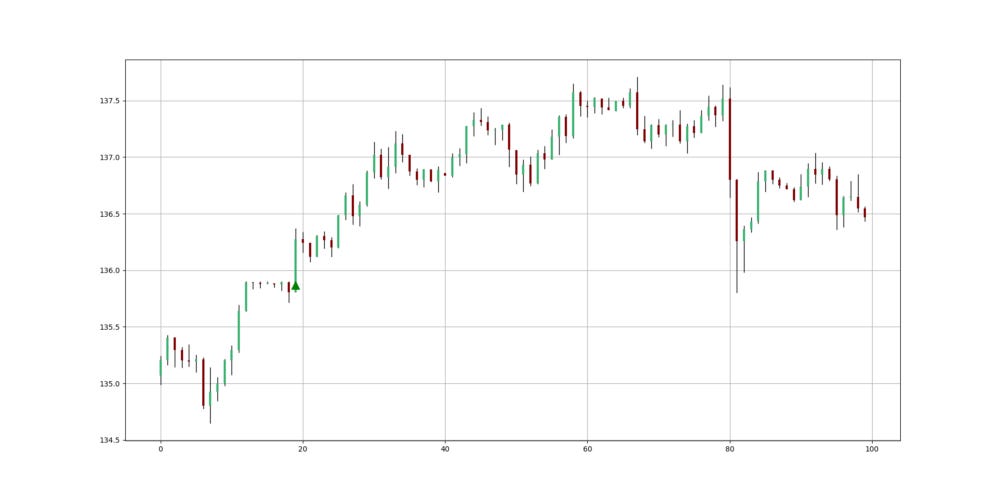
The next Figure shows a signal chart on AUDJPY.

Since no stop limit is given, I will assume a time limit for the position to be exited, that is if we initiate a position, it should not be longer than 10 time periods before closing at the close price of the candle. This is of course risky but it better than not having a stop at all.
Let’s take a look at the back-testing results on USDCHF’s hourly values since 2012:
Hit Ratio = 67.40%
Profit factor = 1.46
Realized RR = 0.708
Number of Trades = 181
Take a look at the below equity curve.
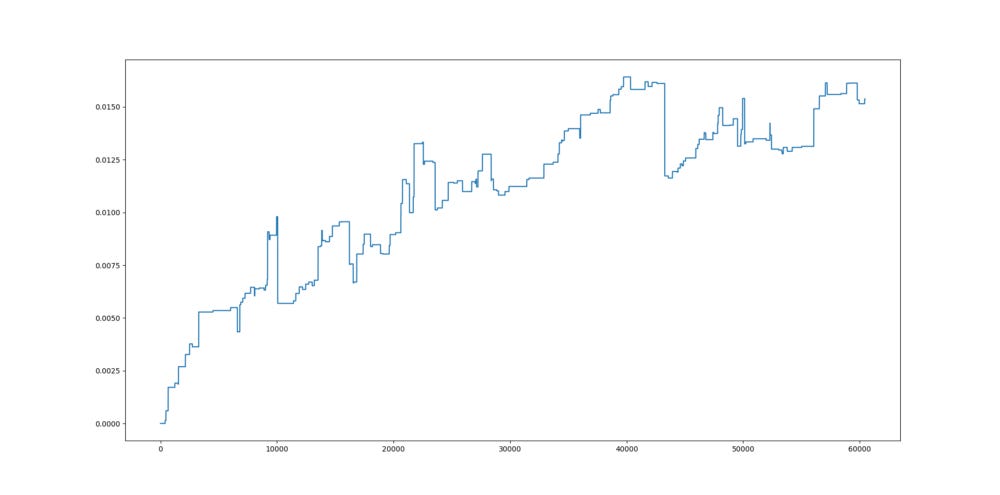
It seems that the strategy has a relatively high hit ratio and provides a mildly upwards sloping equity curve but the following points must be addressed:
The covered back-testing period is only on the hourly time frame.
The back-test is conducted only on EURUSD.
No sensitivity nor stress-testing has been applied thus the results are not indicative.
No risk management measure has been taken which renders the strategy difficult to implement.
No transaction costs have been considered.
Since the the top formed, the equity curve has not managed to surpass it.
If you want to see how to create all sorts of algorithms yourself, feel free to check out Lumiwealth. From algorithmic trading to blockchain and machine learning, they have hands-on detailed courses that I highly recommend.
Learn Algorithmic Trading with Python Lumiwealth
Learn how to create your own trading algorithms for stocks, options, crypto and more from the experts at Lumiwealth. Click to learn more
Summary
To sum up, what I am trying to do is to simply contribute to the world of objective technical analysis which is promoting more transparent techniques and strategies that need to be back-tested before being implemented. This way, technical analysis will get rid of the bad reputation of being subjective and scientifically unfounded.
I recommend you always follow the the below steps whenever you come across a trading technique or strategy:
Have a critical mindset and get rid of any emotions.
Back-test it using real life simulation and conditions.
If you find potential, try optimizing it and running a forward test.
Always include transaction costs and any slippage simulation in your tests.
Always include risk management and position sizing in your tests.
Finally, even after making sure of the above, stay careful and monitor the strategy because market dynamics may shift and make the strategy unprofitable.