
Plotting Candlestick Charts in Python — The Easy Way.
The Easy Way to Plot Quick Candlestick Charts With No Specialized Libraries.

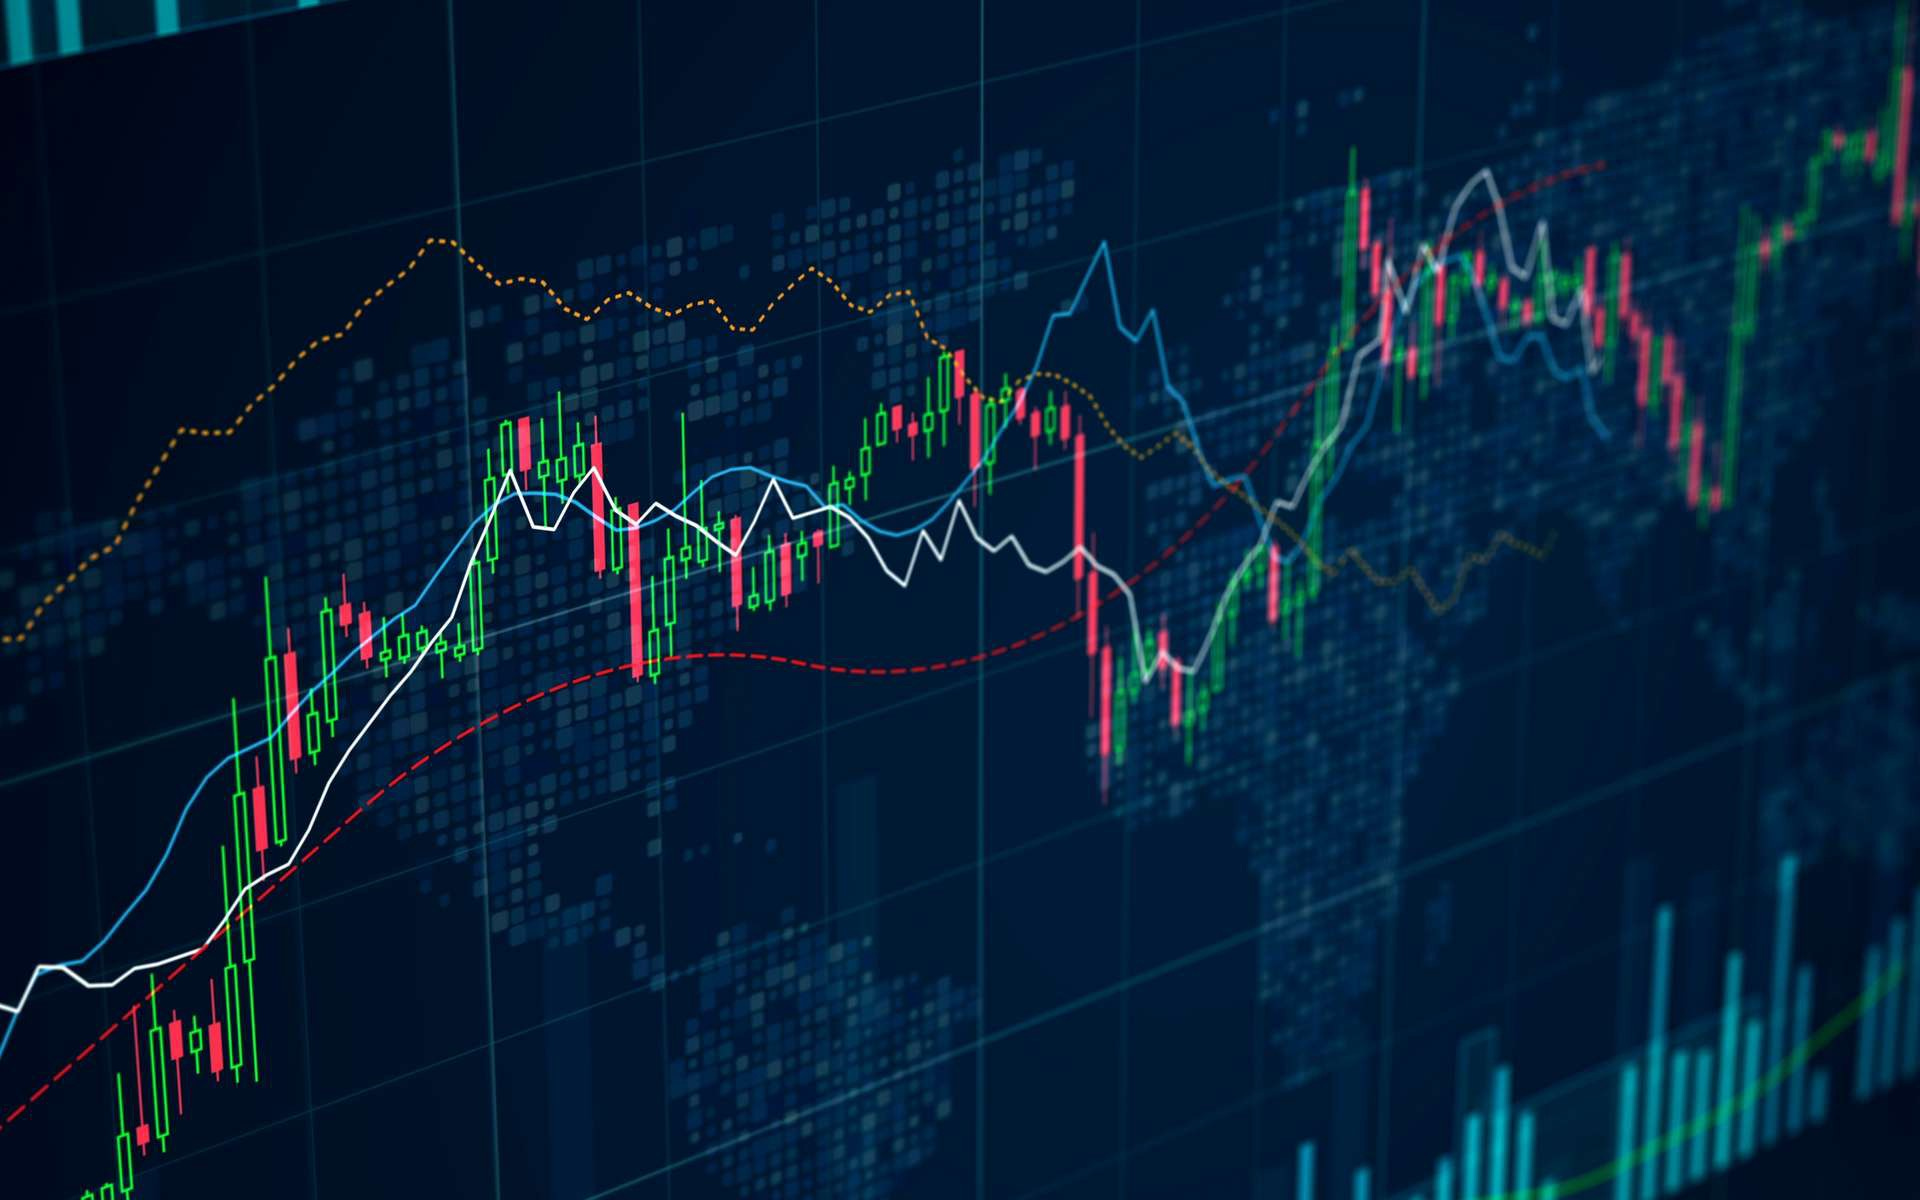
Candlestick charts are among the most famous ways to analyze the time series visually. They contain more information than a simple line chart and have more visual interpretability than bar charts. Many libraries in Python offer charting functions but being someone who suffers from malfunctioning import of libraries and functions alongside their foggines…
