One of the Best Market Patterns For Reversals
Coding the Kangaroo Tail Candlestick Pattern Scanner in TradingView
Candlestick patterns are a great addition to market analysis. Some may even consider them vital in research and trading. This article presents the Kangaroo Tail pattern and shows how to code a scanner in TradingView that detects it.
For the complete collection of candlestick patterns in detail with back-tests and technical strategies, you can check out my newest book with O’Reilly Media. The book features a huge number of classic and modern candlestick patterns as it dwelves into the realm of technical analysis with different trading strategies. The book comes with its own GitHub and is dynamic in nature as it is continuously updated and questions are answered on the O’Reilly platform promptly.
Mastering Financial Pattern Recognition
Amazon.com: Mastering Financial Pattern Recognition eBook : Kaabar, Sofien: Kindle Storeamzn.to
The Kangaroo Tail Pattern
Candlestick charts are among the most famous ways to analyze the time series visually. They contain more information than a simple line chart and have more visual interpretability than bar charts.
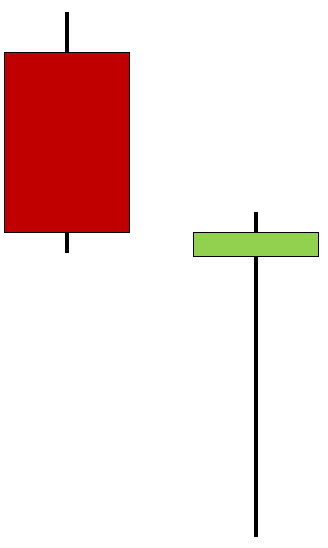
The Kangaroo Tail pattern (as presented by Alex Nekritin and Walter Peters) is a one-candlestick reversal configuration that has roots in classic candlestick patterns (namely the hammer and Doji patterns), therefore, it may resemble them but with a few extra conditions to filter false signals.
The bullish Kangaroo Tail is composed of a very long wick where the open and close price are in the upper two thirds of the candle’s range (the high minus the low). Similarly, it must be in a down trend with a range that is superior to the prior candlesticks (to avoid what is known as a runaway). Some minor conditions are in the code.
The bearish Kangaroo Tail is composed of a very long wick where the open and close price are in the lower two thirds of the candle’s range (the high minus the low). Similarly, it must be in an up trend with a range that is superior to the prior candlesticks (to avoid what is known as a runaway). Some minor conditions are in the code.
Coding the Scanner in TradingView
The conditions of the pattern are relatively easy to code especially in a straightforward and simple coding language such as Pine Script, TradingView’s native language.
The aim of the scanner is to detect the Kangaroo Tail patterns using the following indications:
A green arrow for bullish Kangaroo Tail signals.
A red arrow for bearish Kangaroo Tail signals.
// This source code is subject to the terms of the Mozilla Public License 2.0 at https://mozilla.org/MPL/2.0/
// © Sofien-Kaabar

//@version=5
indicator("Candlestick Pattern - Kangaroo Tail", overlay = true)
look_to_the_left = 200
candle_range = high - low
two_third_candle_range = candle_range * 0.66

bullish_kangaroo_tail = close > (two_third_candle_range + low)   and open > (two_third_candle_range + low) and close > low[1] and close < high[1] and open > low[1] and open < high[1] and close < close[look_to_the_left] and candle_range > candle_range[1] and candle_range > candle_range[2] and candle_range > candle_range[3] and close[1] < open[2] and low <= ta.lowest(low, 13)
bearish_kangaroo_tail = close < (high - two_third_candle_range)   and open < (high - two_third_candle_range) and close > low[1] and close < high[1] and open > low[1] and open < high[1] and close > close[look_to_the_left]  and candle_range > candle_range[1] and candle_range > candle_range[2] and candle_range > candle_range[3] and close[1] > open[1] and high >= ta.lowest(high, 13)

plotshape(bullish_kangaroo_tail,  style = shape.triangleup,   color = color.green,  location =  location.belowbar, size = size.small)
plotshape(bearish_kangaroo_tail,  style = shape.triangledown, color = color.red,    location =  location.abovebar, size = size.small)
The following Figure shows a signal chart after the code has been applied and executed.
The following Figure shows another signal chart.
The following Figure shows another signal chart.
Entry conditions are simple:
The buy pattern is validated following the surpass of the high of the Kangaroo Tail.
The sell pattern is validated following the break of the low of the Kangaroo Tail.
The following Figure shows another signal chart.


