NVDA Financial Analysis Using No-Code FMP Financial Data
Performing a Financial Analysis on NVIDIA as an Example
Financial analysis plays a pivotal role in guiding strategic decision-making and driving organizational success. Traditionally, conducting comprehensive financial analysis has been a time-consuming and resource-intensive task, requiring expertise in coding and data manipulation.
However, with the advent of no-code tools and platforms, professionals across industries now have access to powerful capabilities for data fetching, analysis, and visualization, without the need for extensive programming knowledge.
In this article, we explore how leveraging no-code solutions guides financial analysis by empowering users to extract actionable insights from vast datasets effortlessly.
What is No-Code and How to Use it With FMP
No-code refers to a way of creating software applications without needing to write traditional code. Essentially, it’s a method that allows people who aren’t professional programmers to build software applications. Instead of writing lines of code, users can use visual interfaces, drag-and-drop tools, and pre-built components to design and develop their applications.
✨ Important note
No-code democratizes the process of software development, making it more accessible to a wider range of people, including business users, entrepreneurs, and professionals in various fields who may not have technical coding skills.
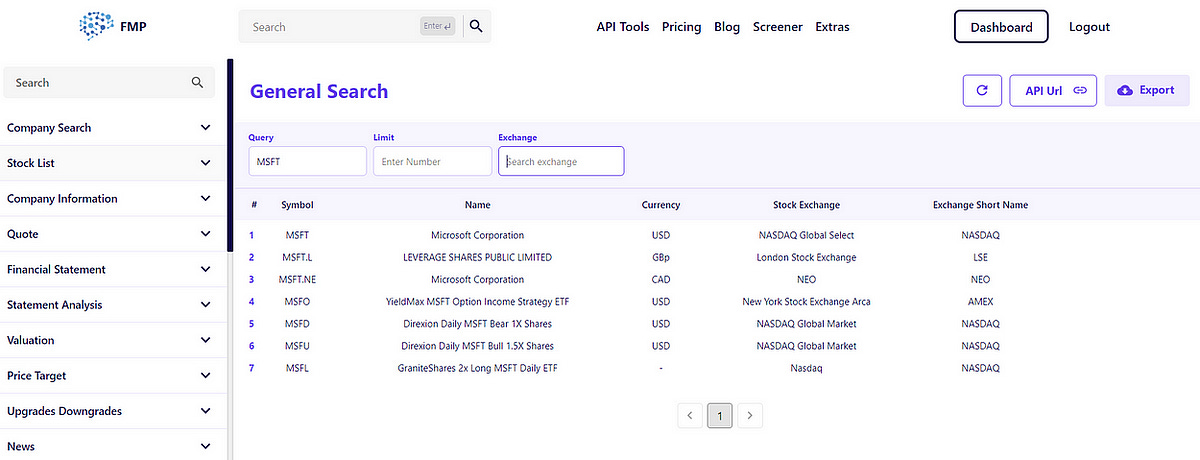
FMP now has API VIEW, which basically the no-code version of what they provide. The interface is extremely user-friendly and has the following appearance:
On the left, the tab lets you choose the different elements such as sentiment analysis and historical data. In the middle, you have the search bar for the asset, and on the right, you have the export option to download the required data.
Let’s see some examples to understand more how the process goes.
FMP is offering 15% discount on their subscriptions currently. Since I’ve started using their services, I’ve partnered with them to share the news. Check it out here:
Pricing Plans - Financial Modeling Prep API
Claim free stock market database API. Get API key for real-time stock market dataintelligence.financialmodelingprep.com
Balance Sheet Analysis
The balance sheet, also known as the statement of financial position, provides a snapshot of a company’s financial condition at a specific point in time. It presents a summary of a company’s assets, liabilities, and shareholders’ equity. The main elements of a balance sheet typically include:
Assets: These represent the economic resources owned or controlled by the company that provide future benefits. Assets are typically categorized into current assets and non-current assets.
Liabilities: These represent the company’s obligations or debts to external parties. Liabilities are also typically categorized into current liabilities and non-current liabilities.
Shareholders’ equity: This represents the residual interest in the company’s assets after deducting liabilities. It represents the amount of capital contributed by the company’s shareholders plus retained earnings.
Let’s get Nvidia’s (Ticker: NVDA) balance sheets since 1999. Go to Financial Statement, then Balance Sheet Statements, and click on export as CSV.
When you open the spreadsheet and do some light cleaning, you can expect to get the following presentation (around 47 columns worth of information and data):
If we want to have a flash look across the time of of the evolution of invenroty since 1999, we can expect to get the following chart:
Income Statement Analysis
The income statement provides a summary of a company’s revenues, expenses, and profits over a specific period. The main elements of an income statement typically include:
Revenue: This is the total amount of money generated from sales of goods or services during the period. Revenue is often broken down by product lines, geographical regions, or other categories to provide further insights into the sources of income.
Cost of Goods Sold (COGS): This represents the direct costs incurred in producing or purchasing the goods sold by the company. COGS includes costs such as raw materials, labor, and manufacturing overhead.
Gross Profit: Gross profit is calculated by subtracting the cost of goods sold from total revenue. It represents the profit generated from sales after accounting for the direct costs of producing or purchasing the goods sold.
EBITDA: The earnings before interest, taxes, depreciation, and amortization (EBITDA) is used to evaluate a company’s operating performance. It gives a clearer picture of a company’s profitability from its core operations by excluding non-operating expenses such as interest, taxes, depreciation, and amortization.
Net Income: Also known as net profit, it is a key metric on a company’s income statement. It represents the total amount of revenue remaining after subtracting all expenses, including operating expenses, interest, taxes, depreciation, and amortization. In other words, net income is the profit a company earns after accounting for all costs associated with generating that revenue.
Let’s get Nvidia’s income statements since 1999. As usual, go to Financial Statement, then Income Statements, and click on export as CSV.
When you open the spreadsheet and do some light cleaning, you can expect to get the following presentation (around 29 columns worth of information and data):
Pricing Plans - Financial Modeling Prep API
Claim free stock market database API. Get API key for real-time stock market dataintelligence.financialmodelingprep.com
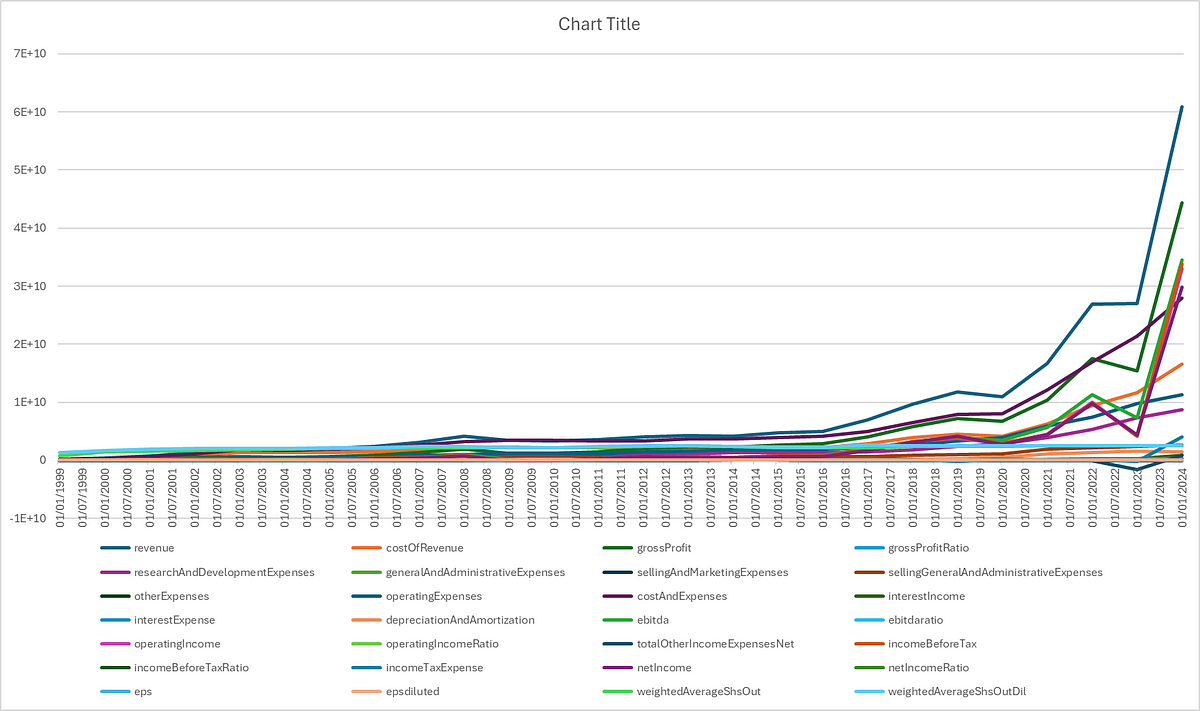
If we want to have a flash look across the time of all the elements, we can simply use Excel’s charting tools on the columns and get the following graph:
Obviously, the general trend is upwards, whether revenue or costs, which implies expansion and growth. Let’s take a look at the next section which helps make sense out of all these numbers.
Financial Ratio Analysis
Financial ratio analysis involves evaluating various financial ratios to gain insights into a company’s financial performance, health, and efficiency. These ratios are calculated using data from the company’s financial statements and are used to assess different aspects of its operations. Among the common ratios:
The current ratio: The current ratio is a financial ratio that measures a company’s ability to cover its short-term liabilities with its short-term assets. It is calculated by dividing a company’s current assets by its current liabilities. The formula for the current ratio is:
The gross profit margin: The gross profit margin is a financial metric that measures the percentage of revenue that exceeds the cost of goods sold (COGS). It indicates how efficiently a company is producing and selling its products or services before accounting for other expenses such as operating expenses, taxes, and interest. The formula for calculating the gross profit margin is:
Return on equiy: ROE is a financial ratio that measures a company’s profitability relative to its shareholders’ equity. It indicates how effectively a company is using its equity to generate profits. ROE is calculated by dividing net income by average shareholders’ equity, and it is usually expressed as a percentage.
Price to earnings ratio: PER is a commonly used financial metric that compares a company’s current stock price to its earnings per share (EPS). It is widely used by investors to assess the valuation of a company’s stock and to compare it with other companies in the same industry or the broader market. The formula for calculating the Price-to-Earnings (P/E) ratio is:
Let’s take an example and divide the total current assets column by the total current liabilities column of NVDA, and have a look at its evolution across the years.
It looks like i’ts stagnating throughout the years with no clear trend. This could imply several things:
A stagnating current assets ratio might suggest that the company’s liquidity position is relatively stable. It indicates that the company’s current assets are consistently able to cover its short-term liabilities, but there hasn’t been significant improvement or deterioration in this regard.
It could indicate that the company is managing its current assets and liabilities in a balanced manner. The company might be maintaining an optimal level of inventory, receivables, and cash to meet its short-term obligations without overcommitting resources.
Stagnation in the current assets ratio could also be influenced by external economic conditions. For example, if the company operates in an industry or market with stagnant demand or slow economic growth, it might reflect in the stability of its current assets ratio.
It is interesting to know that you can also compare the current ratio to the current ratios of similar company. This type of analysis can be done using as many ratios as you want, and by the end you can develop a score for each stock (its relative attractiveness).
If we want to calculate the ROE, we will need both Excel files and divide the net income column by the equity column. The evolution throughout time should look like this:
Notice the rising trend as the stock compensates investors for putting their money in it.
Pricing Plans - Financial Modeling Prep API
Claim free stock market database API. Get API key for real-time stock market dataintelligence.financialmodelingprep.com
Conclusion
In conclusion, the emergence of no-code data providers represents a significant paradigm shift in the world of data analytics and business intelligence. By offering intuitive, user-friendly platforms that require minimal coding knowledge, these services empower organizations to harness the full potential of their data without the barriers of technical complexity.
Through the exploration of FMP’s no-code functionality, it becomes evident that accessibility, efficiency, and versatility are at the forefront of its service. Whether it’s through streamlined data integration, customizable visualization tools, or advanced analytics capabilities, FMP empowers users of all skill levels to derive actionable insights and drive informed decision-making.


Hello Sofien,
personnaly, i use BuildAlpha in the same context that no-code generated strategies with extension robustness and Monte Carlo test, etc.
I dont know if you know ?
Jean