


New Breed of Technical Indicators — Red
Discussing a New Technical Indicator and Coding it in TradingView


This article discusses one of the indicators of a set called the Rainbow Indicators which are structured and unique combinations of price-derived techniques aimed to help the trader predict reversals or to confirm the on-going trend. The indicator discussed is called the Red indicator, a contrarian method based on the concept of volatility re-integration.
For a detailed and thorough collection of trend following trading strategies, you can check out my book. The book features a huge number of classic and modern techniques as it dwelves into the realm of technical analysis with different trading strategies. The book comes with its own GitHub.
Trend Following Strategies in Python: How to Use Indicators to Follow the Trend.
Amazon.com: Trend Following Strategies in Python: How to Use Indicators to Follow the Trend.: 9798756939620: Kaabar…amzn.to
Creating the Red Indicator
Volatility bands refer to the set of dynamic support and resistance levels calculated on the basis of moving averages and standard deviations. The most known volatility bands are the Bollinger bands which use simple moving averages and standard deviations.
The Red indicator calculates a 20-period exponential moving average which is then subtracted/added to the 20-period standard deviation with a multiplier of 2.
The Red indicator is therefore used as follows:
A bullish signal is generated whenever the current close price surpasses the lower volatility band after having been below it for at least five periods.
A bearish signal is generated whenever the current close price breaks the upper volatility band after having been above it for at least five periods.
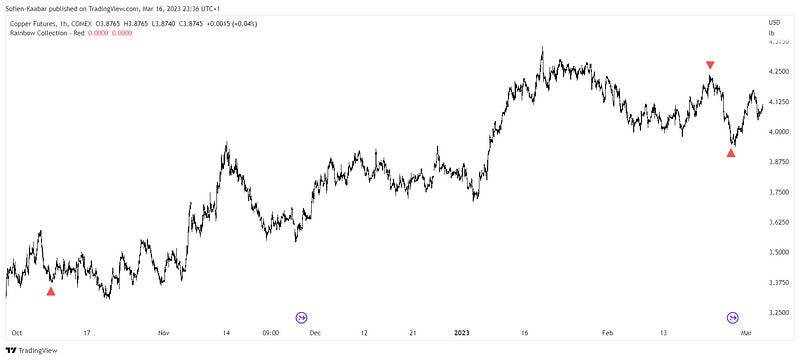
For simplicity, the indicators of the Rainbow collection are charted in an overlay arrow-based technique where only confirmed signals are shown (as opposed to showing the indicator on its own).
Coding the Red Indicator
Pine Script is TradingView’s main coding language which is very user-friendly. We will code this indicator and check out its signals. The next Figure shows the with the signals generated from the indicator.
// This source code is subject to the terms of the Mozilla Public License 2.0 at https://mozilla.org/MPL/2.0/
// © Sofien-Kaabar

//@version=5
indicator("Rainbow Collection - Red", overlay = true)

lower_band = ta.ema(close, 20) - (ta.stdev(close, 20) * 2)
upper_band = ta.ema(close, 20) + (ta.stdev(close, 20) * 2)

buy  = close > lower_band and close[1] < lower_band[1] and close[2] < lower_band[2] and close[3] < lower_band[3] and close[4] < lower_band[4] and close[5] < lower_band[5]
sell = close < upper_band and close[1] > upper_band[1] and close[2] > upper_band[2] and close[3] > upper_band[3] and close[4] > upper_band[4] and close[5] > upper_band[5]

plotshape(buy and sell[1] == 0,  style = shape.triangleup,   color = color.red,  location =  location.belowbar, size = size.small)
plotshape(sell and buy[1] == 0,  style = shape.triangledown, color = color.red,    location =  location.abovebar, size = size.small)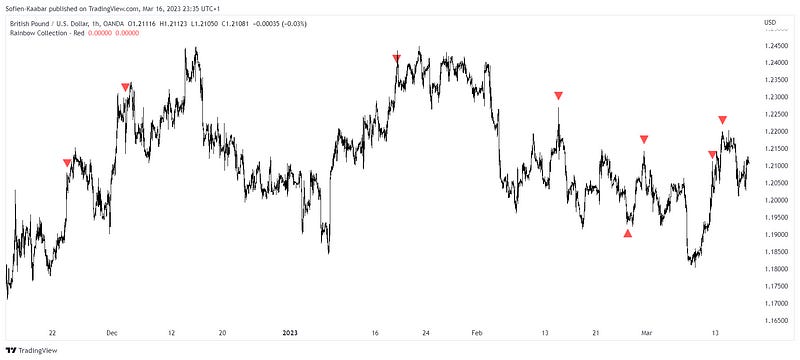
Summary
To sum up, what I am trying to do is to simply contribute to the world of objective technical analysis which is promoting more transparent techniques and strategies that need to be back-tested before being implemented. This way, technical analysis will get rid of the bad reputation of being subjective and scientifically unfounded.
I recommend you always follow the the below steps whenever you come across a trading technique or strategy:
Have a critical mindset and get rid of any emotions.
Back-test it using real life simulation and conditions.
If you find potential, try optimizing it and running a forward test.
Always include transaction costs and any slippage simulation in your tests.
Always include risk management and position sizing in your tests.
Finally, even after making sure of the above, stay careful and monitor the strategy because market dynamics may shift and make the strategy unprofitable.
Thank you for sharing these indicators, it’s greatly appreciated! I’m fairly new to coding in general so being able to see the thought process behind some code is extremely helpful.