
My One Technical Indicator You Should Absolutely Use
Back to the Old Days of Creating Custom Technical Indicators


The Yellow Indicator is built around a simple idea: momentum extremes are often more useful when they are viewed as a sequence, not as isolated readings.
Many RSI based tools focus only on whether the oscillator is above or below a fixed threshold. This indicator adds a timing condition around the RSI movement itself. It does not simply mark every interaction with the 30 or 70 levels. Instead, it waits for a specific change in short term RSI behavior after the oscillator has recently interacted with one of those zones.
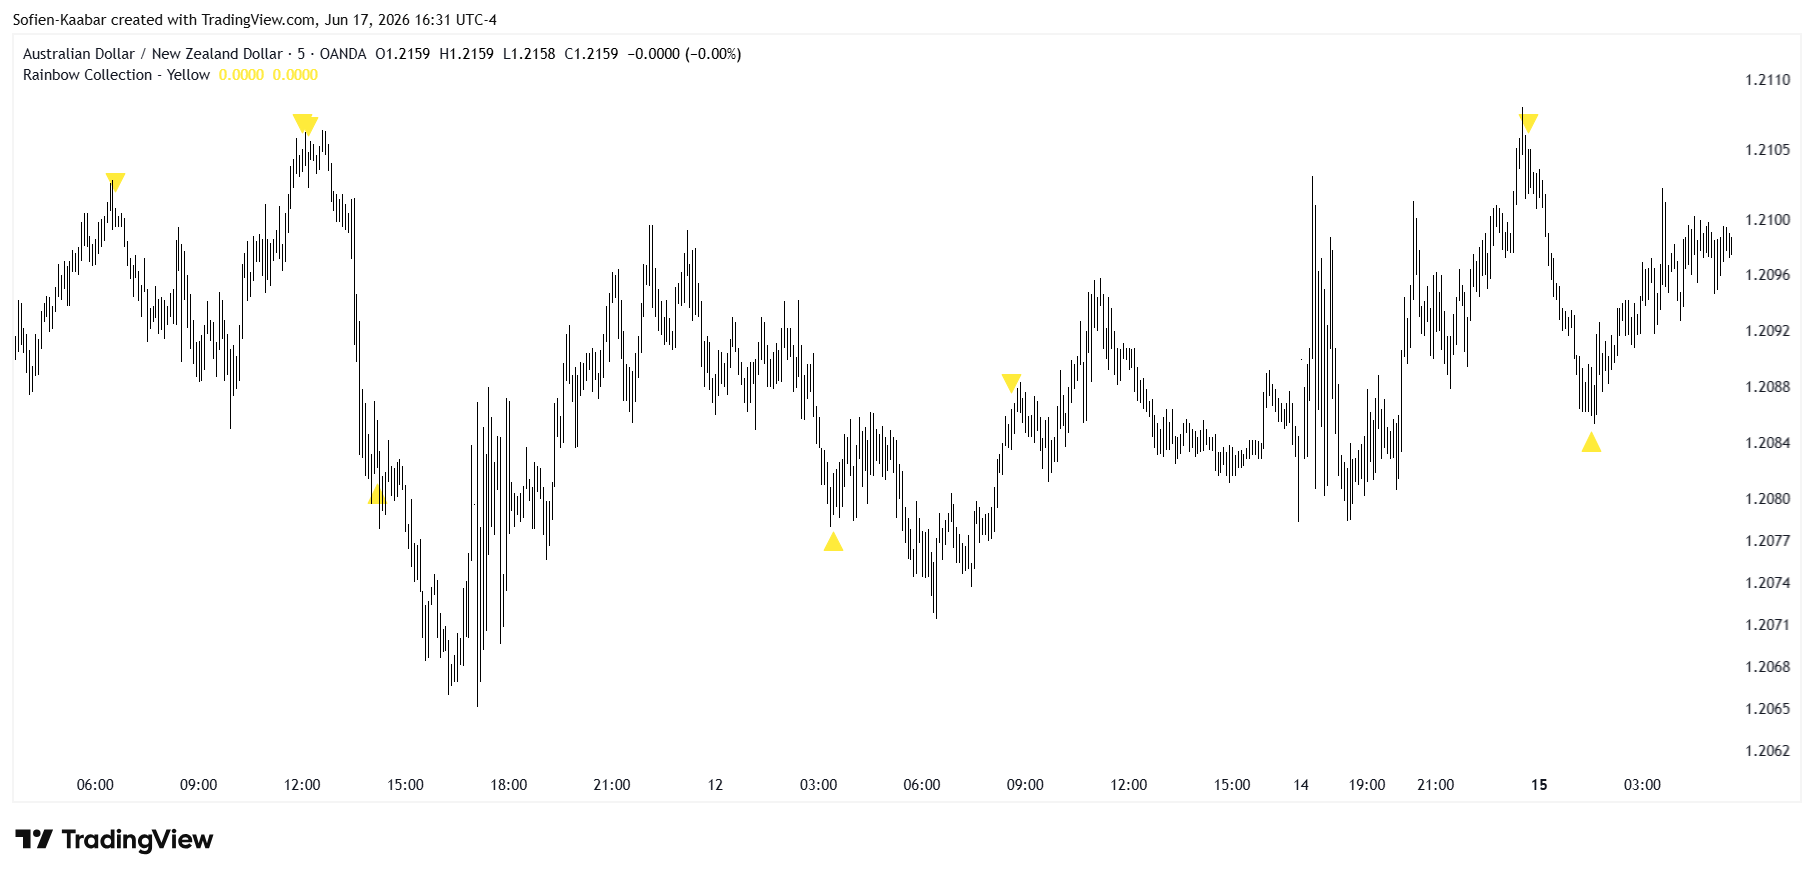
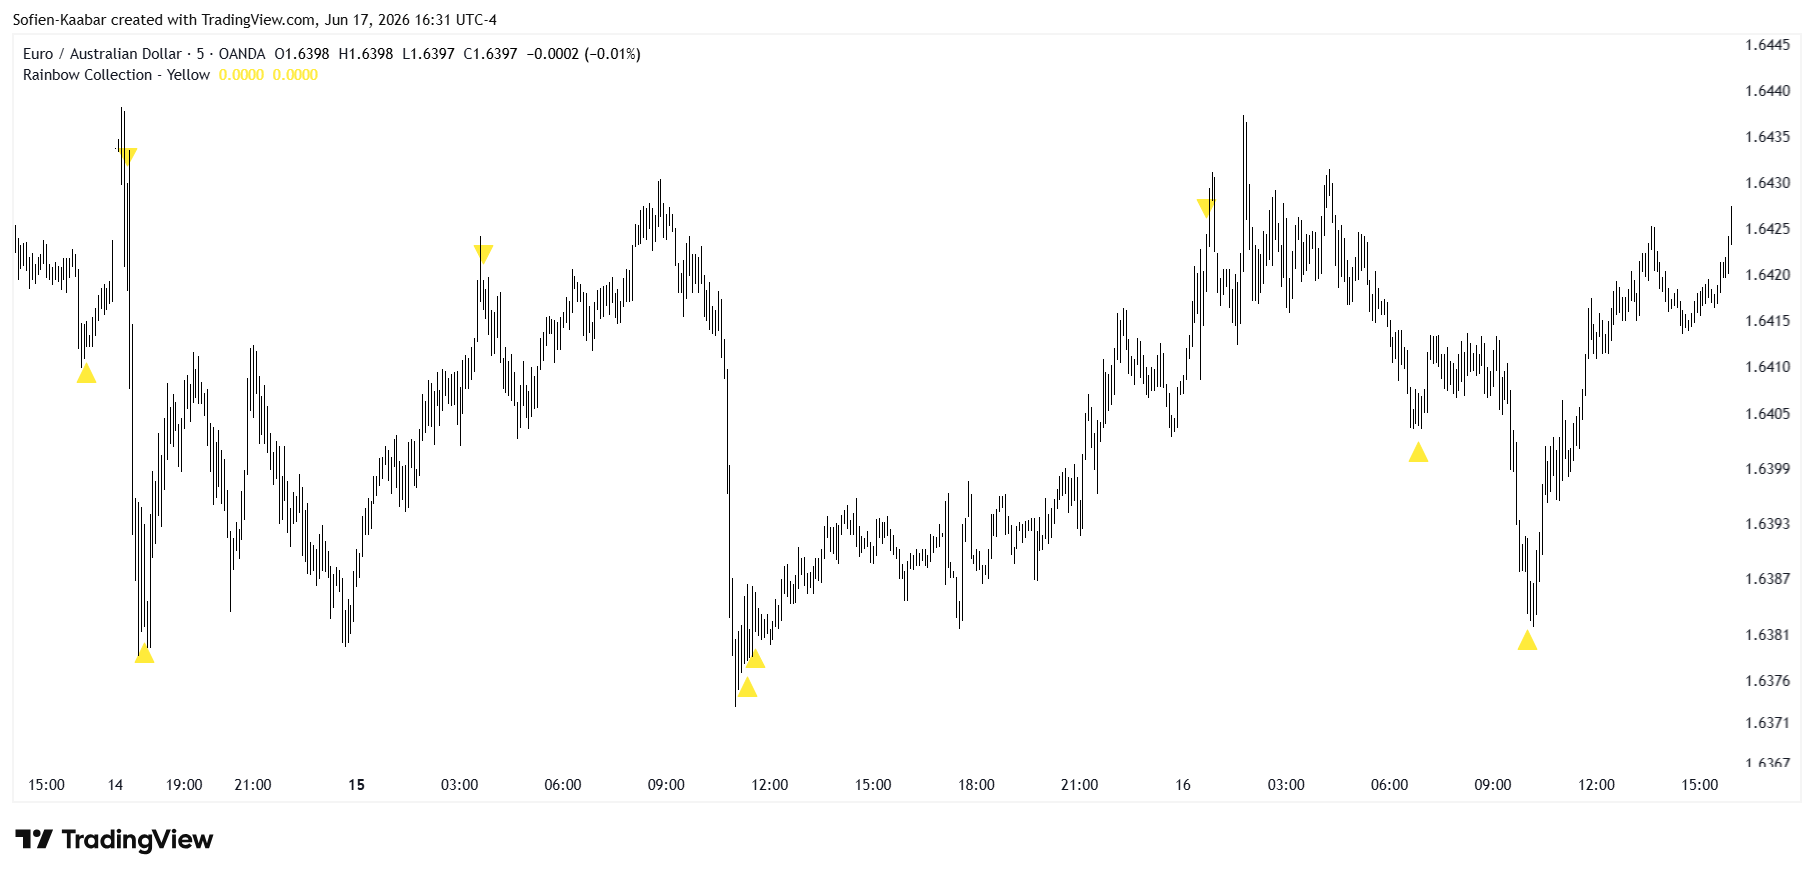
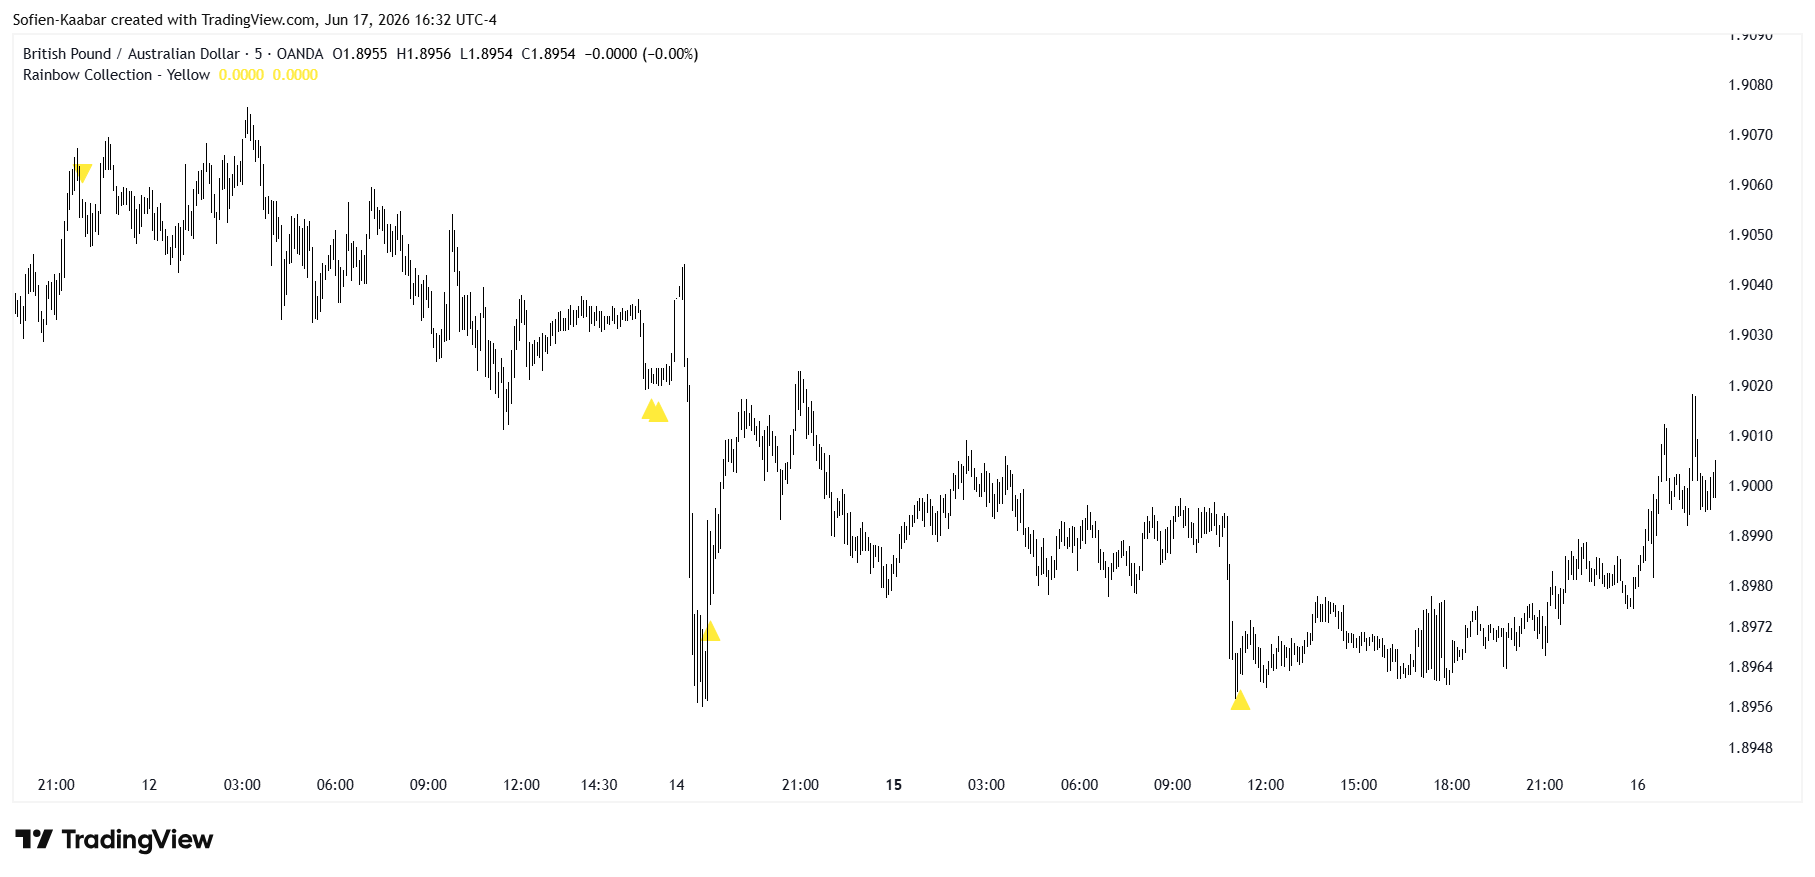
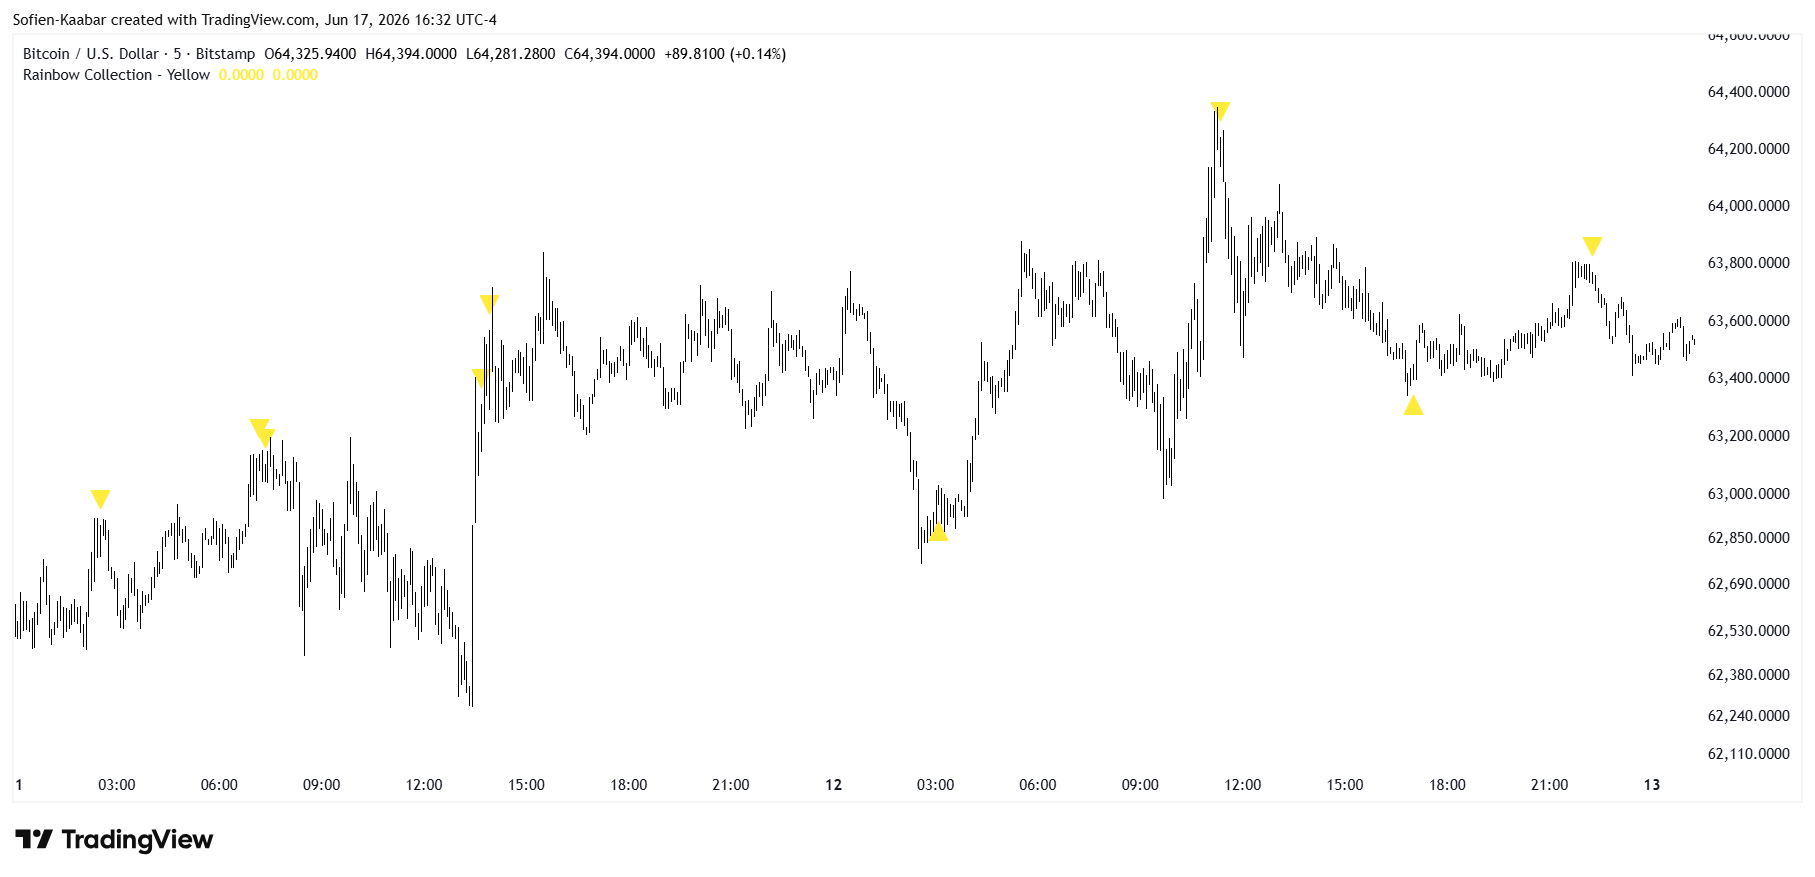
The result is a clean chart overlay that plots yellow triangle signals directly on price.
Signals below the candle represent one type of momentum condition. Signals above the candle represent the opposite type of momentum condition. The indicator is designed to be visually simple, with the logic hidden behind the chart markers rather than displayed as a separate oscillator panel.
What the Indicator Measures
The indicator uses the Relative Strength Index with a period of 13.
The RSI is a momentum oscillator that measures the speed and magnitude of recent price changes. In this script, it is not plotted directly. It is used internally to detect specific shifts in momentum behavior.
The key levels are 30 and 70.
These levels are widely used in RSI analysis, but the indicator does not treat them as automatic signal points. A signal only appears when several conditions are met at the same time.
The script checks:
The current RSI direction compared with the previous RSI value.
Whether the previous RSI value was positioned around one of the key threshold zones.
Whether the RSI interacted with the opposite side of that threshold sequence two bars ago.
Whether the RSI state thirteen bars ago confirms that the setup is not just a single isolated fluctuation.
This gives the indicator a small structural memory. It looks at the current RSI, the previous two RSI values, and the RSI value thirteen bars earlier.
That is the main difference between a basic RSI threshold marker and this indicator.
Yellow is not just asking:
“Is RSI low or high?”
It is asking:
“Has RSI recently moved through a specific threshold sequence, and is the current behavior consistent with a signal condition?”
🚨 Get your Quant Atlas Free trial (no credit card required) 🚨
Sign up takes ~9 seconds before you have unconditional 10-day access to 100+ market forecasts.
How the Signal Logic Works
The script creates two internal signal conditions.
The first condition is plotted as a yellow upward triangle below the candle.
This condition requires the RSI to be lower than its previous value. It also requires the previous RSI value to be above 30, the RSI from two bars ago to be below 30, and the RSI from thirteen bars ago to be above 30.
In practical terms, the indicator is looking for a short term RSI sequence around the lower threshold zone, with an additional lookback condition to avoid treating every small fluctuation as a signal.
The second condition is plotted as a yellow downward triangle above the candle.
This condition requires the RSI to be higher than its previous value. It also requires the previous RSI value to be below 70, the RSI from two bars ago to be above 70, and the RSI from thirteen bars ago to be below 70.
This creates a mirrored logic around the upper threshold zone.
The two signal types are symmetrical in structure. Both use the same RSI period, the same short term comparison logic, and the same thirteen bar reference check.
The purpose is not to mark every RSI extreme. The purpose is to isolate a specific momentum transition around the threshold zones.
Why the Indicator Is Plotted on Price
Although the calculation is based on RSI, the output is plotted directly on the price chart.
This makes the indicator easier to use visually. Instead of watching a separate oscillator window, the trader can see where the signal appears relative to the candle structure, recent swings, and surrounding price action.
The indicator uses yellow triangles for both signal types.
The visual design is intentionally minimal. There are no bands, no colored clouds, no complex dashboard, and no extra moving parts. The signal either appears or it does not.
This helps keep the chart clean.
Signal Filtering
The script also includes a simple one bar filter.
For the lower chart signal, the script checks that the opposite signal was not active on the previous bar.
For the upper chart signal, the script checks that the lower chart signal was not active on the previous bar.
This reduces immediate back to back conflict between opposite signal types.
The filter is not complicated, but it improves the visual behavior of the indicator. It helps avoid situations where the chart becomes crowded with alternating markers in a very short period.
The indicator remains reactive, but the signal output is slightly cleaner.
What the Code Does
The script begins by defining the indicator:
indicator("Rainbow Collection - Yellow", overlay = true)The overlay setting means the signals are displayed directly on the price chart instead of in a separate panel.
The RSI calculation is then created:
rsi = ta.rsi(close, 13)This calculates a 13 period RSI using the closing price.
The first signal condition is:
buy = rsi < rsi[1] and rsi[1] > 30 and rsi[2] < 30 and rsi[13] > 30This condition checks four things:
The current RSI is lower than the previous RSI.
The previous RSI was above 30.
The RSI two bars ago was below 30.
The RSI thirteen bars ago was above 30.
The second signal condition is:
sell = rsi > rsi[1] and rsi[1] < 70 and rsi[2] > 70 and rsi[13] < 70This condition mirrors the previous logic around the 70 level.
It checks:
The current RSI is higher than the previous RSI.
The previous RSI was below 70.
The RSI two bars ago was above 70.
The RSI thirteen bars ago was below 70.
The plotting section then displays the signals:
plotshape(buy and sell[1] == 0, style = shape.triangleup, color = color.yellow, location = location.belowbar, size = size.small)
plotshape(sell and buy[1] == 0, style = shape.triangledown, color = color.yellow, location = location.abovebar, size = size.small)
The first line plots a yellow upward triangle below the candle.
The second line plots a yellow downward triangle above the candle.
Both signals are small, clean, and designed to avoid unnecessary chart clutter.
Practical Interpretation
Yellow should be understood as a signal timing tool based on RSI threshold behavior.
It does not forecast price directly. It does not produce targets, stops, or position sizing. It identifies specific momentum conditions and displays them visually on the chart.
This makes the indicator useful as a supporting layer rather than a complete trading system. A trader can study the signals in relation to:
Recent price structure.
Support and resistance zones.
Trend direction.
Volatility conditions.
Candle behavior around the signal.
Broader market context.
The signal itself is only one piece of information. Its usefulness depends on where it appears and how it behaves across different market conditions.
Strengths of the Indicator
The indicator has three main strengths.
First, it is simple.
The calculation uses one RSI period, two threshold zones, and a short lookback structure. This makes it easy to understand and easy to inspect.
Second, it is clean.
The output is limited to yellow triangles on price. There is no visual overload.
Third, it uses sequence logic.
Instead of marking every RSI threshold event, the indicator checks how RSI behaved across several bars. This creates a more selective signal than a basic overbought or oversold marker.
Limitations
The indicator should not be interpreted as a standalone decision system.
RSI based signals can behave differently across market regimes. In strongly directional markets, threshold based signals can appear early. In range bound markets, they may appear more frequently. In volatile markets, the sequence may trigger during unstable price behavior.
This is why the signal should be tested across assets, timeframes, and market conditions. The indicator gives a structured signal.
The research process determines whether that signal is useful.
Sofien, is the entire TradingView script the 8 lines you spread through the article? Or is the complete script located somewhere else we can access it?