

Among the more unconventional trading techniques some people use is moon phases, which is based on the belief that lunar cycles influence financial markets. This idea stems from financial astrology, which asserts that celestial bodies impact human behavior and, by extension, market sentiment.
However, despite its intrigue, it lacks scientific validity and is not a reliable tool for trading. This article will explore how the indicator is calculated, its purported benefits, limitations, and why financial astrology fails to provide a robust foundation for investment decisions.
Understanding the Moon Phases Indicator
Four main components are of interest when it comes to using moon phases in trading and financial forecasting:
New moon – Occurs when the moon is between the Earth and the Sun.
First quarter moon – The moon is half-illuminated and growing (waxing phase).
Full moon – The entire face of the moon is illuminated.
Last quarter moon – The moon is half-illuminated and shrinking (waning phase).
Proponents of the indicator claim that certain moon phases correlate with market trends. The most common strategy involves buying during the new moon and selling around the full moon, assuming a bullish pattern between these phases.
Conversely, some traders use the indicator to identify potential market reversals, believing that the full moon marks local price peaks while the new moon signals bottoms.
Using Moon Phases in Trading
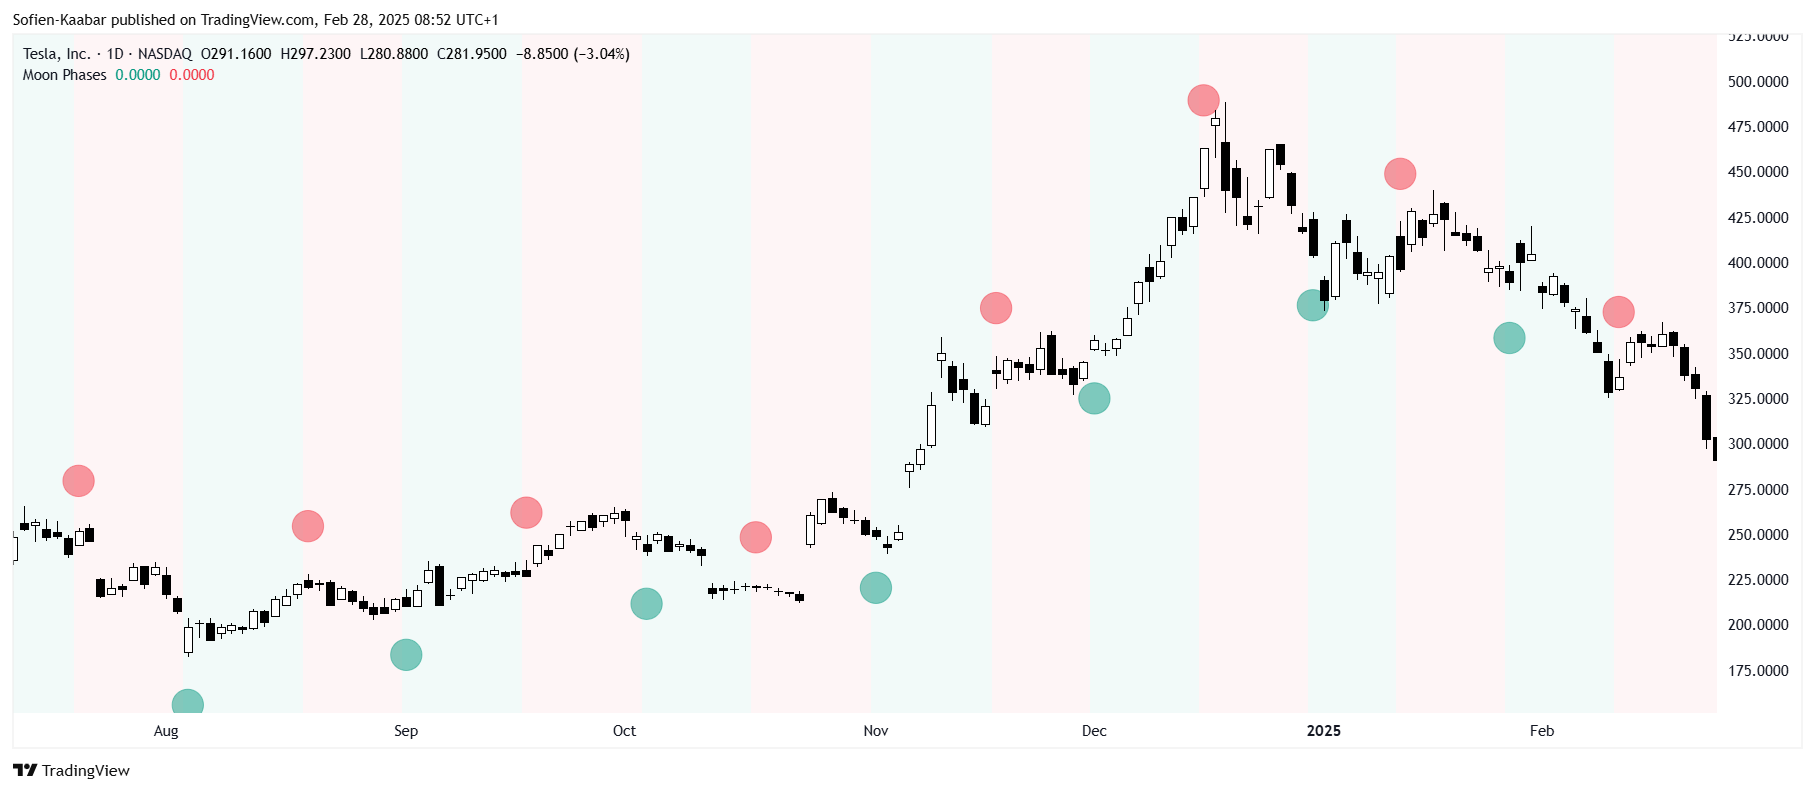
Astro traders use this indicator in conjunction with traditional tools like moving averages, RSI, and MACD to reinforce their strategies. Others use them in raw form. Take a look at the following chart. Green circles mark full moons while red circles mark red circles (additionally, waxing phases are green in the background and waning phases are red).

Theoretically, you are supposed to long the asset when a green circle appears and to short it when a red circle appears. But, you and I both know this is hocus pocus. This article is simply informational, and possibly to make you want to back-test this strategy. Who knows, maybe I am wrong about financial astrology.
Check out my newsletter that sends weekly directional views every weekend to highlight the important trading opportunities using a mix between sentiment analysis (COT report, put-call ratio, etc.) and rules-based technical analysis.

The following chart shows moon phases appled on NVIDIA’s stock price. You may say that a full moon occurred around the historical tops, but then again it occurred many times before without a sizable bearish reaction.
Among the pros of moon phases is that they require only lunar data and can be easily overlaid on charts. Also, since some traders believe in its effect, it could create self-fulfilling prophecies where collective action aligns with lunar phases.
But of course, no empirical evidence confirms a causal relationship between moon phases and market movements. Observed correlations may be coincidental rather than predictive.
The reality is that stock prices are influenced by economic indicators, geopolitical events, and investor sentiment—factors unrelated to lunar cycles.
Financial astrology relies on celestial patterns rather than fundamental or technical analysis. The primary reasons why this approach lacks credibility are:
Studies analyzing historical market data do not support a statistical correlation between lunar cycles and stock prices.
Confirmation bias leads traders to notice instances where the indicator "worked" while ignoring times it failed.
Markets are driven by supply and demand, corporate earnings, interest rates, and economic policies—not the positions of celestial bodies.
Unlike proven indicators that are based on mathematical principles, financial astrology has no logical mechanism explaining why planets or the moon would affect stock prices.
You should focus on proven technical and fundamental analysis methods rather than relying on financial astrology, which is based on superstition rather than data-driven insights. While moon phases may capture curiosity, making investment decisions based on such an indicator is speculative at best and misleading at worst.