Money in The Trees: Using Random Forests to Predict The Economy
How Random Forests Offer Insights Into the ISM PMI
Much like a dense woodland of decision trees, Random Forests employ an ensemble learning approach that combines the predictive power of numerous models to yield a robust and accurate forecast. This exploration seeks to demystify the algorithmic magic behind these forests, shedding light on how they dissect and interpret complex economic data such as the ISM PMI.
The ISM PMI
The ISM PMI, or Institute for Supply Management Purchasing Managers’ Index, is a widely watched economic indicator in the United States. It provides insight into the health of the manufacturing sector. The PMI is based on a survey of purchasing managers from various industries, asking about things like new orders, production, employment, supplier deliveries, and inventories.
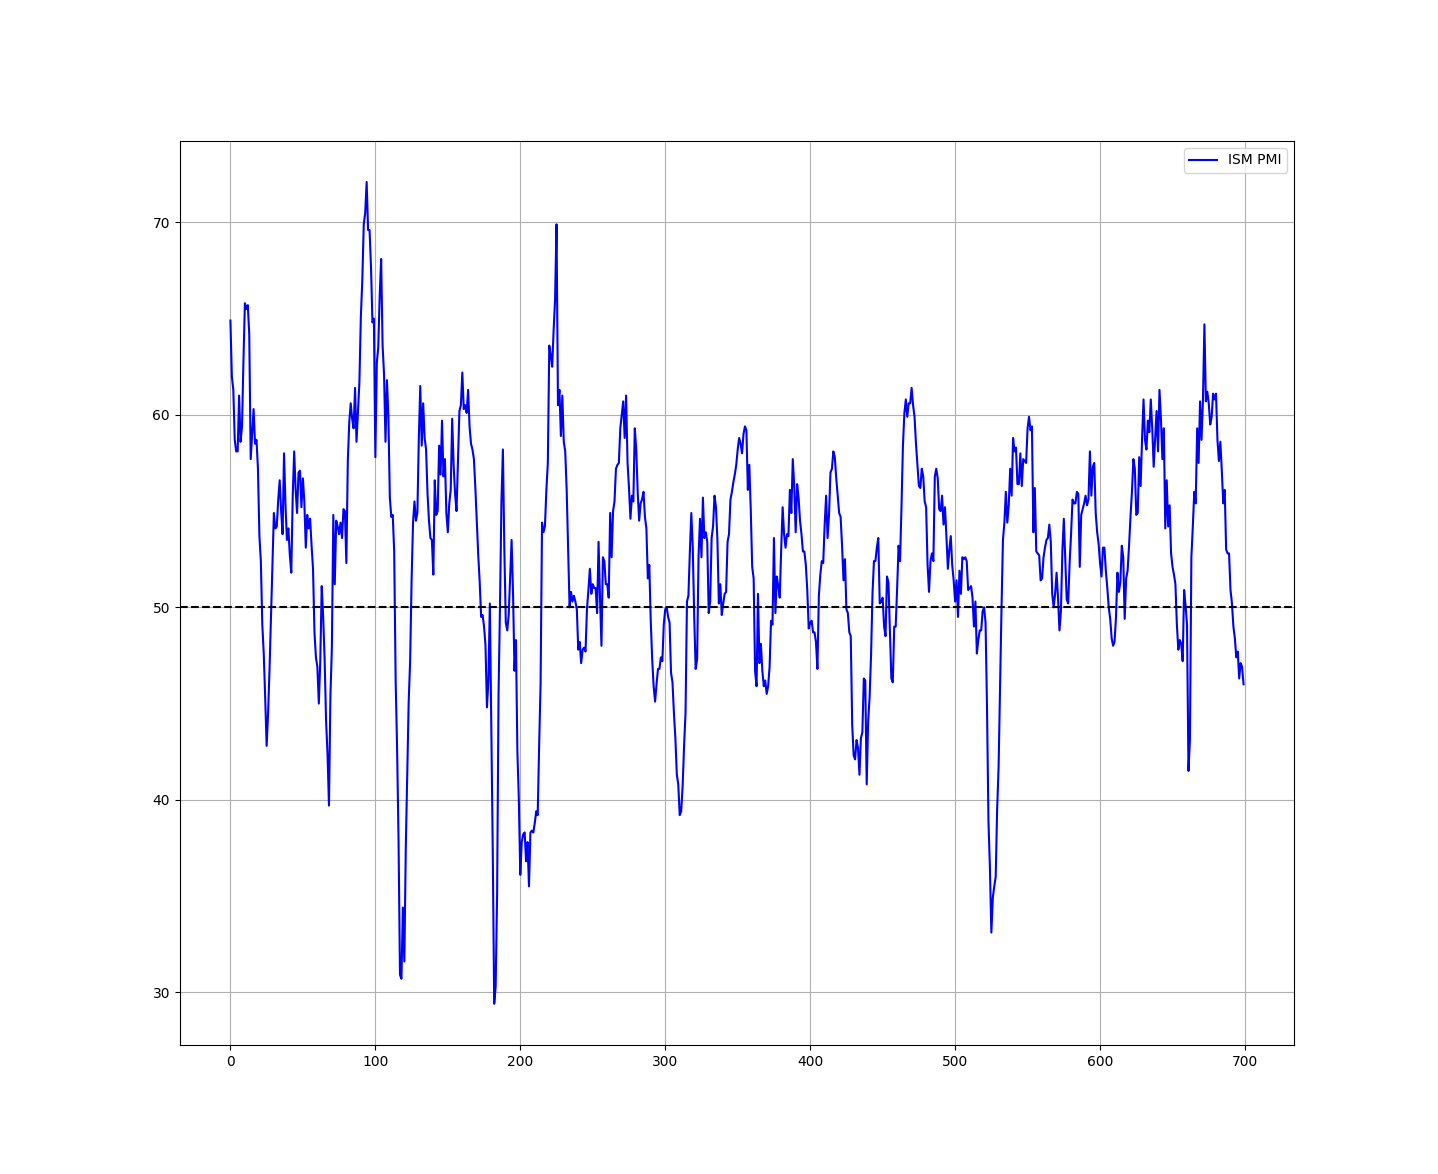
The ISM PMI helps us understand how well the manufacturing businesses are doing. It’s like a report card that looks at different aspects of these businesses, such as how many new orders they’re getting, how much they’re producing, whether they’re hiring more people, and how quickly they’re getting supplies. If the PMI is above 50, it generally means the manufacturing sector is expanding, and if it’s below 50, it suggests a contraction.
In essence, it’s a useful tool for analysts, investors, and policymakers to gauge the overall economic health and trends in the manufacturing industry.
The following shows the monthly evolution of the ISM PMI.
In the next section, we will create a random forest forecasting algorithm in Python that will use the past changes in the value of the ISM PMI to forecast the next changes.
You can also check out my other newsletter The Weekly Market Sentiment Report that sends tactical directional views every weekend to highlight the important trading opportunities using a mix between sentiment analysis (COT reports, Put-Call ratio, Gamma exposure index, etc.) and technical analysis.
Creating the Algorithm
The framework of this study is as follows:
Download and import the ISM PMI data from here.
Take the difference of the data in order to make it stationary.
Split the data into training and test sets (while using lagged values as features or predictors). Fit and predict using the random forest regression algorithm.
Evaluate the model.
Use the following code to create the algorithm:
import pandas as pd
import matplotlib.pyplot as plt
import numpy as np
from sklearn.ensemble import RandomForestRegressor

# importing the time series
data = np.diff(np.reshape(np.array(pd.read_excel('ISM_PMI.xlsx')), (-1)))

# Setting the hyperparameters
num_lags = 4
train_test_split = 0.98

def data_preprocessing(data, num_lags, train_test_split):
    # Prepare the data for training
    x = []
    y = []
    for i in range(len(data) - num_lags):
        x.append(data[i:i + num_lags])
        y.append(data[i+ num_lags])
    # Convert the data to numpy arrays
    x = np.array(x)
    y = np.array(y)
    # Split the data into training and testing sets
    split_index = int(train_test_split * len(x))
    x_train = x[:split_index]
    y_train = y[:split_index]
    x_test = x[split_index:]
    y_test = y[split_index:]

    return x_train, y_train, x_test, y_test

# Creating the training and test sets
x_train, y_train, x_test, y_test = data_preprocessing(data, num_lags, train_test_split)

# Fitting the model
model = RandomForestRegressor(max_depth = 50, random_state = 123)

# Fit the model to the data
model.fit(x_train, y_train)
y_pred = model.predict(x_test)

# Plotting
plt.plot(y_pred[-100:], label='Predicted Data', linestyle='--', marker = '.', color = 'red')
plt.plot(y_test[-100:], label='True Data', marker = '.', alpha = 0.7, color = 'blue')
plt.legend()
plt.grid()
plt.axhline(y = 0, color = 'black', linestyle = '--')

same_sign_count = np.sum(np.sign(y_pred) == np.sign(y_test)) / len(y_test) * 100
print('Hit Ratio = ', same_sign_count, '%')
The following graph shows the comparison between true and predicted data.
The following is the result of the algotihm:
Hit Ratio = 66.66 %The ISM PMI is heavily correlated to the US GDP, and thus properly predicting its direction may give huge insights to predicting the next stage of the US economic growth. Surely, the must be tuned and must include other variables, but its potential is uncanny.
You can also check out my other newsletter The Weekly Market Analysis Report that sends tactical directional views every weekend to highlight the important trading opportunities using technical analysis that stem from modern indicators. The newsletter is free.
If you liked this article, do not hesitate to like and comment, to further the discussion!


