


Trends are important concepts. This article presents a new and modern technical indicator I call the Symmetry Index which is a market regime indicator.
Trends in a Nutshell
Imagine you’re standing on a beach watching waves roll in. Some waves are small ripples, some are big, and sometimes the tide itself is coming in or going out.
That’s how financial markets move — they rise and fall in waves, but underneath those waves is a general direction: up, down, or sideways. That general direction over time is called a trend.
An uptrend is when prices, on average, keep going higher. Even though there are small drops (no market goes up in a straight line), each new “high” tends to be higher than the last one, and each pullback stops above the last dip. You can think of it like walking upstairs: you take steps down between steps up, but you keep rising.
A downtrend is the opposite — prices are generally moving lower. You might see some small rallies, but each one fails to reach the previous high. Think of it like walking downstairs: sometimes you pause or step up a bit, but overall, you’re going down.
Sometimes prices don’t go up or down much at all — they move sideways, bouncing between two rough boundaries (a ceiling and a floor). This is like the ocean at low tide: lots of movement, but no real progress.
Trends form because crowds of traders and investors act together over time.
When more people want to buy than sell → prices rise.
When more people want to sell than buy → prices fall.
Most trading ideas come down to one of these two beliefs:
“The trend is your friend.” → You trade with the direction of the trend, expecting it to continue.
“Trends eventually reverse.” → You trade against it, trying to catch turning points.
✨ The Weekly Market Sentiment Report is evolving into The Signal Beyond 🚀.
This isn’t just a sentiment check anymore. It’s becoming a full market intelligence package with expanded technical scorecards, refined sentiment models, and machine learning forecasts. From classic tools that have stood the test of time to fresh innovations like multi-market RSI heatmaps, volatility regime dashboards, and pairs trading recommendation system, the new report is designed to give you a sharper edge in navigating the markets.
Free trial available.
The Symmetry Index
The Symmetry Index (SI) is designed to measure how balanced the recent price movement is between upward and downward swings.
In other words:
“Are buyers and sellers equally strong, or is one side dominating?”
It looks at how much total distance price has covered upwards and downwards over a given period — then compares the two.
Let’s assume you want to calculate the SI over the last N bars (for example, N = 20). We’ll use closing prices.
Step 1️⃣: Get price changes per bar
Step 2️⃣: Separate up moves and down moves
Step 3️⃣: Sum up the total up and down moves over N bars
Step 4️⃣: Compute the symmetry ratio

The SI is a measure of structural equilibrium — a kind of market physics ratio.
Think of it like this:
The market is a seesaw.
Bulls sit on one side, bears on the other.
The Symmetry Index tells you who’s heavier.
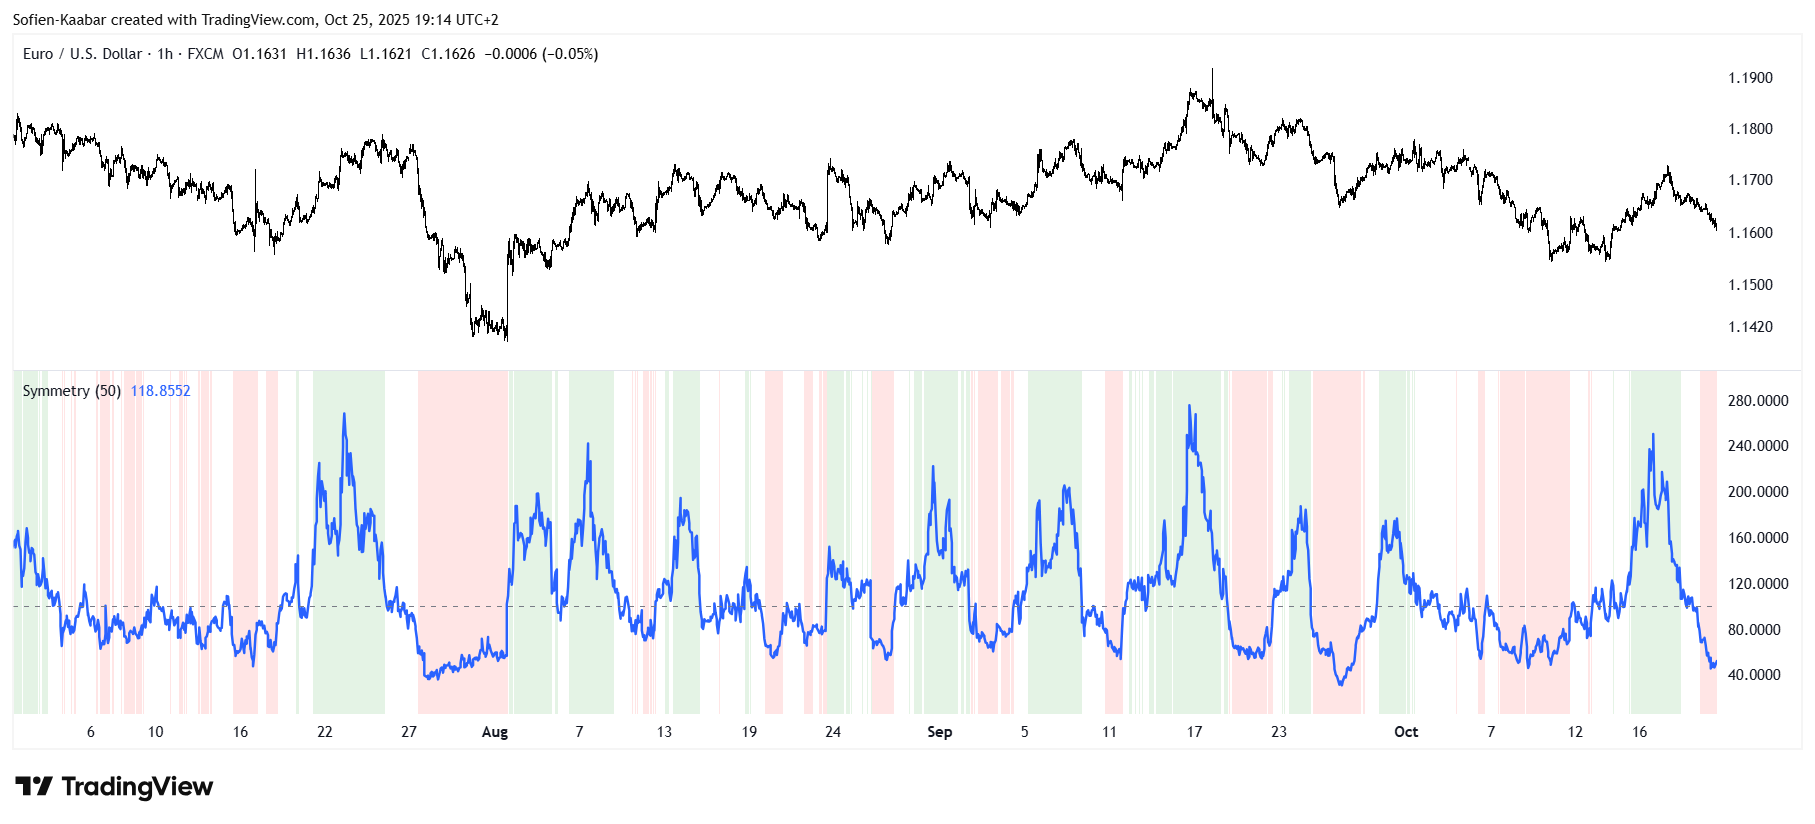
Use the following code to create the indicator:
//@version=5
indicator(”Symmetry Index”, shorttitle=”Symmetry”, overlay=false)

lookback = input.int(20, “Swing Lookback”)

// Compute swing amplitude (price change per bar)
upMoves   = math.sum(close > close[1] ? close - close[1] : 0, lookback)
downMoves = math.sum(close < close[1] ? close[1] - close : 0, lookback)

// Avoid division by zero
symmetry = downMoves > 0 ? (upMoves / downMoves) * 100 : na

plot(symmetry, color=color.new(color.blue, 0), linewidth=2, title=”Symmetry Index”)
hline(100, “Balanced Line”, color=color.gray)
bgcolor(symmetry > 120 ? color.new(color.green, 85) : symmetry < 80 ? color.new(color.red, 85) : na)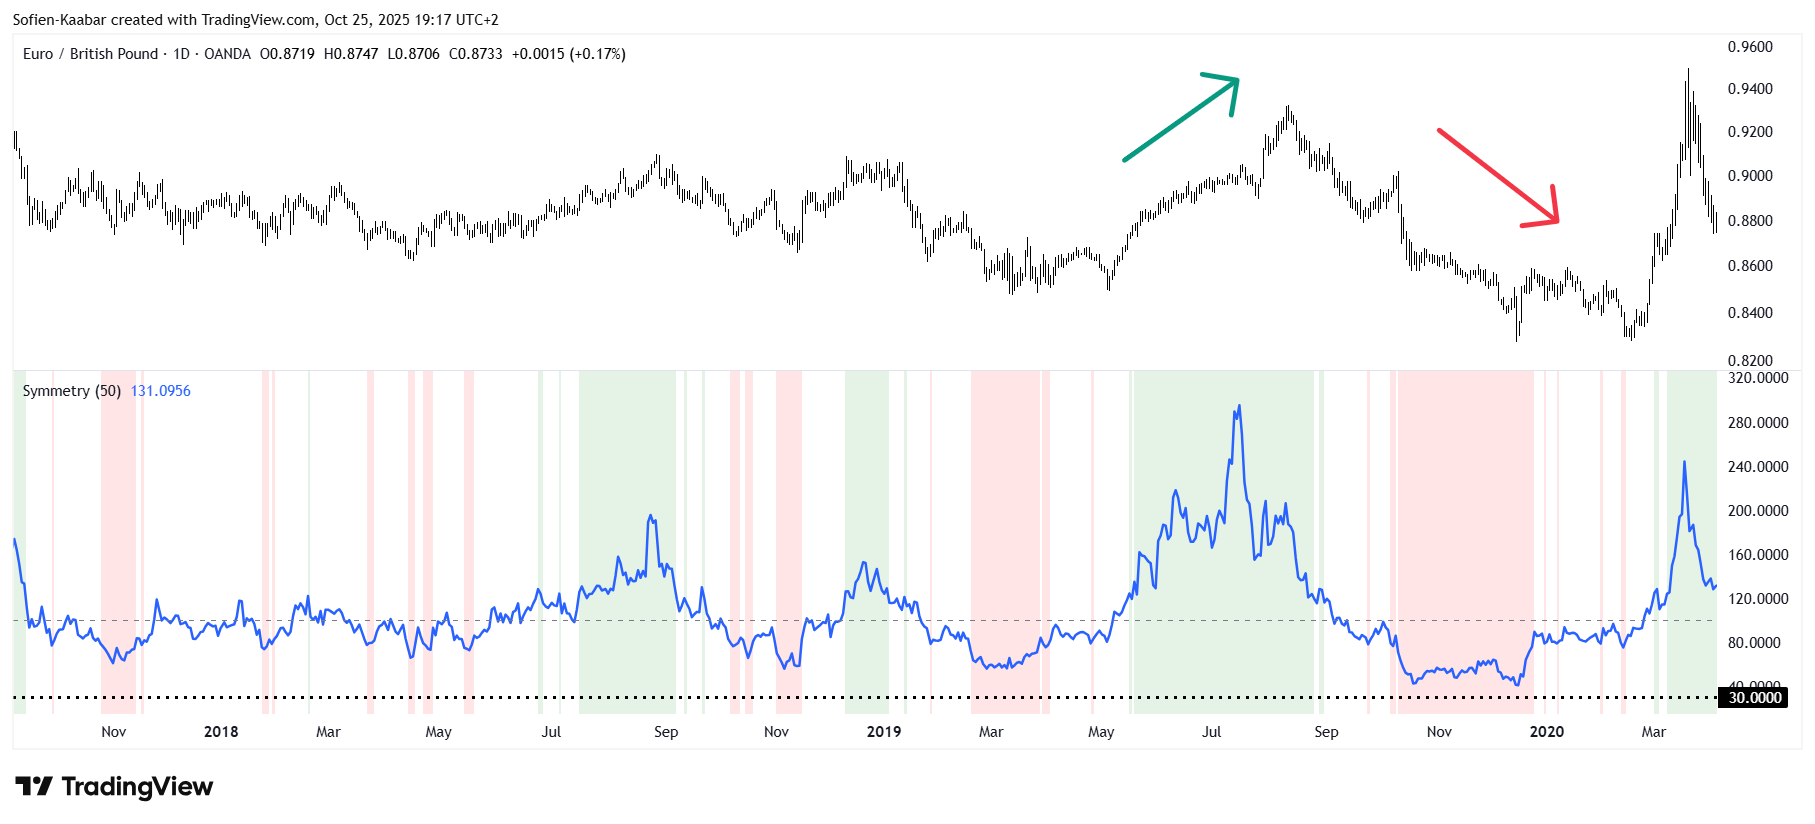
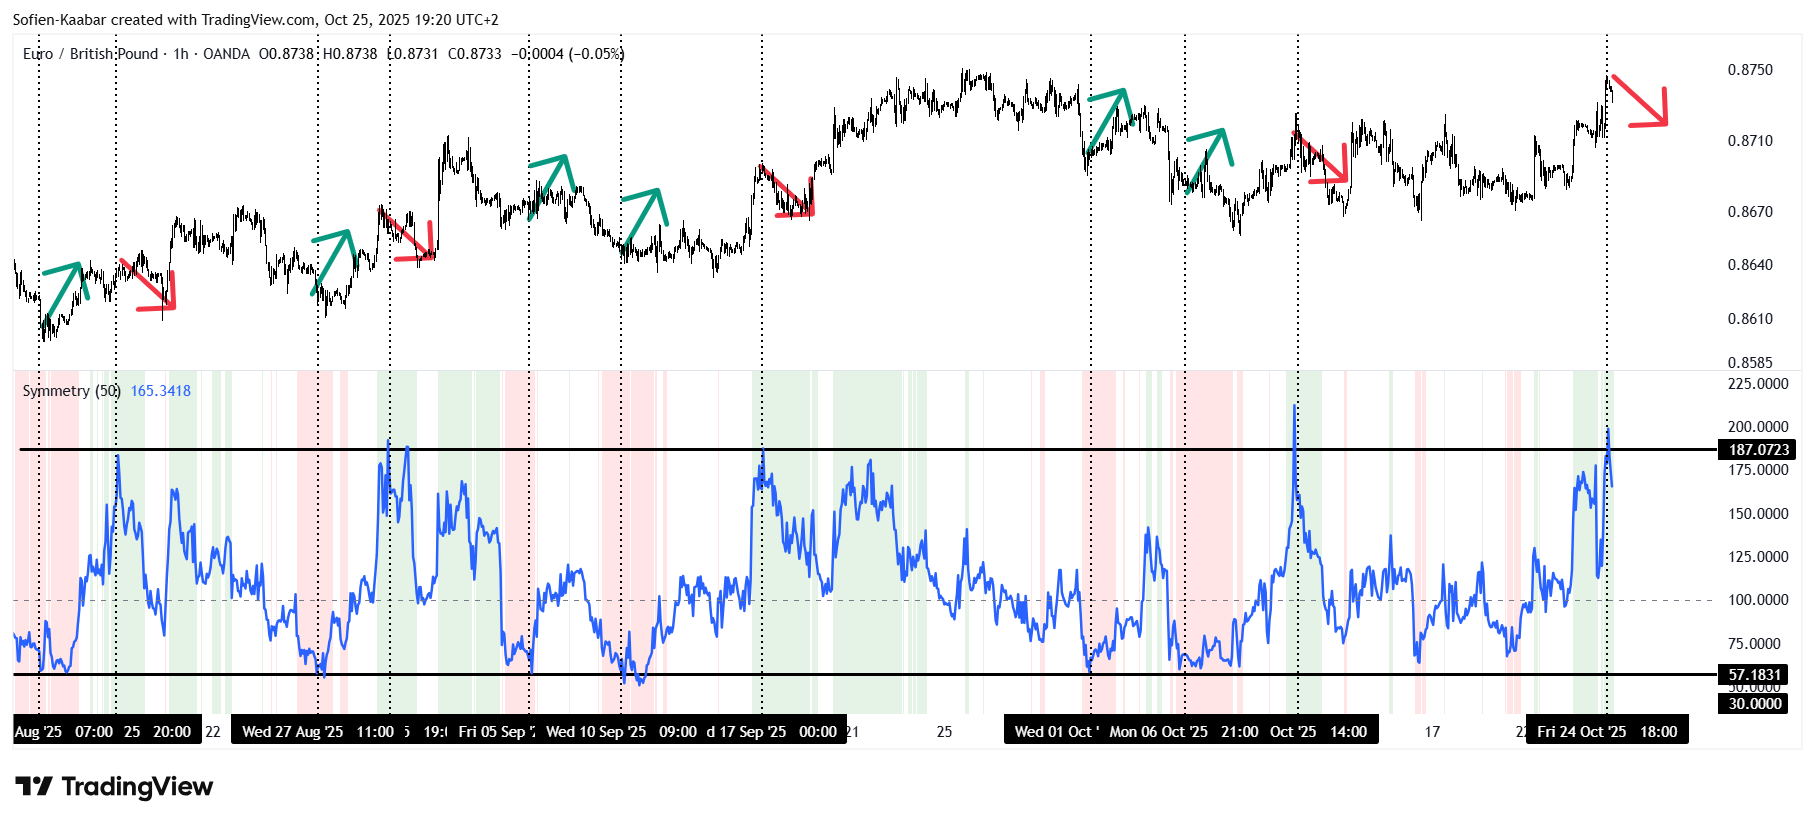
The following chart shows how to use this indicator with subjective barriers in order to play contrarian short-lived reactions
Do you want to master Deep Learning techniques tailored for time series, trading, and market analysis🔥? My book breaks it all down from basic machine learning to complex multi-period LSTM forecasting while going through concepts such as fractional differentiation and forecasting thresholds. Get your copy here 📖!