


Looking at Volatility Bands From Another Angle
Showing an Interesting Bollinger Bands Trading Technique


Bollinger bands represent one of the basic indicators to know in technical analysis. However, there are many ways of using it. This article presents a technique to be applied on Bollinger bands.
The Fibonacci Trading Book is finally out! Filled with Fibonacci-based trading methods (tools, indicators, patterns, and strategies), this book will guide you through improving your trading and analysis by incorporating an important technical analysis approach that is Fibonacci [PDF Version available, see end of article).
The Fibonacci Trading Book
Amazon.com: The Fibonacci Trading Book: 9798394344046: Kaabar, Sofien: Booksamzn.to
What Are Bollinger Bands?
Bollinger Bands are a popular technical analysis tool used by traders and investors to analyze the volatility and potential price movements of a financial asset, such as stocks, currencies, or commodities. They were developed by John Bollinger in the 1980s and have since become widely used in the financial industry.
Bollinger Bands consist of three lines plotted on a price chart: a middle band, an upper band, and a lower band. The middle band is typically a simple moving average (SMA) of the asset’s price over a specified period. The upper and lower bands are calculated by adding and subtracting a specified number of standard deviations from the middle band.
The standard settings for Bollinger Bands use a 20-period SMA and a standard deviation of 2. However, traders can adjust these settings based on their preferences and the characteristics of the asset they are analyzing. For example, some traders may use a shorter or longer time period for the SMA and a different number of standard deviations.
The purpose of Bollinger Bands is to provide a visual representation of the volatility of the asset’s price. When the price is more volatile, the bands expand, and when the price is less volatile, the bands contract. The distance between the upper and lower bands indicates the range within which the price is expected to move. The narrower the bands, the tighter the range, suggesting lower volatility, while wider bands suggest higher volatility.
It’s important to note that Bollinger Bands are not foolproof and should be used in conjunction with other technical analysis tools and indicators to make informed trading decisions. Traders often combine Bollinger Bands with other indicators such as oscillators, trend lines, or candlestick patterns to gain a more comprehensive understanding of the market conditions and price trends. The following Figure shows an example of EURUSD with Bollinger bands applied:

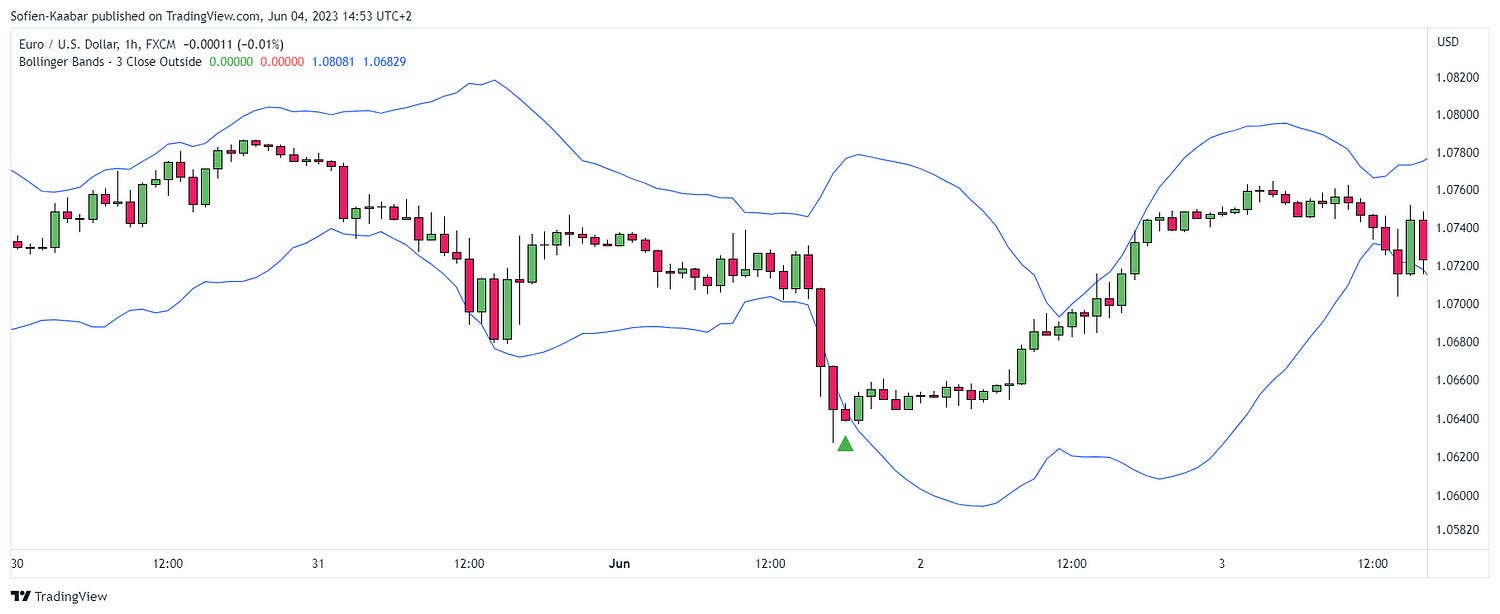
The three close outside (TCO) technique assumes three consecutive close prices outside normality before detecting a reversal. The multiplier is 2.5 instead of 2.0. This increases the width of the bands and theoretically decreases the false signals. The trading conditions are as follows:
A bullish signal is generated whenever the market shapes three consecutive closes below the lower band.
A bearish signal is generated whenever the market shapes three consecutive closes above the upper band.
The following Figure shows an example of a bullish signal:
Bollinger bands work well in ranging markets. The following Figure shows a few signals:

The following Figure shows more signals:

Pay Kaabar using PayPal.Me
Go to paypal.me/sofienkaabar and type in the amount. Since it’s PayPal, it’s easy and secure. Don’t have a PayPal…paypal.me
Trending markets are the bands’ worst enemy and you should avoid using them in that case. The following Figure shows a few failed signals:
